My current job title is Learning Data Architect and Analyst. I spend my days thinking through how to connect data across applications, how to automate workflows, and what questions need to be asked to understand what data is telling me. I spend the majority of my time wrangling data and turning it into graphs and charts that are easily and visually digestible.
But I wasn't always an architect.
Getting started—from Excel to SQL
I entered the data space as an Excel power user. I would download huge CSV files and manipulate them for hours in order to get a few charts to share insights with. I never imagined there was a better way to operate until I learned the source of this CSV file: The database. This piece of software has fundamentally changed the way I think. I didn't realize I could connect to and communicate with the database that lay underneath at scale and in an automated fashion. I learned basic SQL so I could join and find data. At that point, I became hooked. Tasks that used to take hours now took minutes.
I remember looking at my first real database schema for an application. Every data input was meticulously recorded in a tedious structure. I was mesmerized. I never knew so much data was available to access. It allowed me to learn to reverse engineer every single interaction on applications and understand that data is sitting somewhere in some database.
My first real step to starting my architecture was learning to integrate two separate databases into one with as few columns as possible and keep it updating daily. This was my first attempt at documenting and writing my own schema. It made me think differently, planning out the key used in JOIN clauses, and it taught me about normalization. I also had to set up a server to run my nightly synchronization job.
Once this new unified database was ready, I had the challenge of opening it up for other applications to consume the data for reporting. I had to configure an API layer that an application could access and query the data for consumption. This is how my first end-to-end architecture was born.
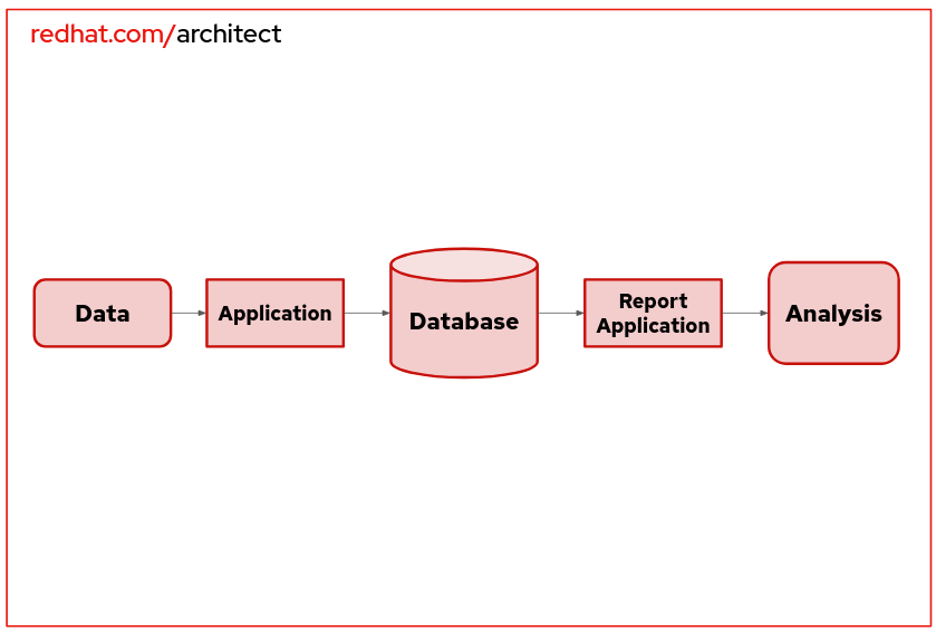
My data architecture automatically mines multiple endpoints, joins them into a single database, and pushes data to various monitoring and analysis applications.

As the amount of data consumed by the system and the outputs increased, there have been adjustments to the underlying technologies I used to get my job done. My work exposes me to a diverse range of technologies—MySQL, PostgreSQL, MongoDB, Postman for API testing, and several JavaScript applications. I extract, transform, and visualize data using technologies like Tableau, R, and Python. While the how is regularly changing, the what of my job is always the same: I am ultimately responsible for the quality of the data for the entire lifecycle of this system.
If this sounds like a role for you, great! We need more data-savvy storytellers out there.
Getting started
Here are some tips to get there.
Repeat, repeat, repeat!
Computers follow a structured pattern that needs to be replicable. Write down the steps it took for your data to be structured in its final form and repeat those steps. Once you have that, it can be programmed and replicated on a server in an automated fashion. In my experience, 80-90% of data analysis is in cleaning the data.
Set up a server
The real workhorse to automation is your extract, transform, and load (ETL) process. It will take a lot of practice to determine your repeatable processes that need to be automated away as you build out the data architecture. My main tool is an open source application called Pentaho that runs on a small server, but I've also used Python, AppScript, and even task scheduler to automate the ETL process of data for reporting and analytics. These steps take a lot of practice, so take the time to do get familiar. Once you have your data in a usable form, challenge yourself to set up a secure database and then to access the data again. My data is used on web applications, reporting applications, and even imported into other data lakes from a single endpoint. This preserves the integrity of the data and ensures all data is consistent across multiple applications.
Visualize your data
Raw data can be intimidating to other team members, and part of a Data Architect's job is to help others process it visually. Choosing the correct visualization tool can help you make the right business decisions faster by spending more time on understanding the data and less time on prepping it. Play around with the full range of libraries available to Python users like Seaborn or Matplotlib, but also expand out into common business tools and languages.
Wrap up
A Data Architect can provide the organization with so much actionable information in a form that is easy to understand and use. Follow these tips to move your career in this exciting direction. With a love for data and enough practice throughout this process, I hope you can progress into a Data Architect role as I have.
About the author

Jesse is a Learning Data Architect and Analyst for Red Hat devoted to data-driven learning. He specializes in providing insight into database storage, engineering, and utilization methods. He also creates automated and secure solutions to provide operational reporting that extends into deeper analytics.
Jesse currently resides in Raleigh, NC where, when he's not massaging data, he's trying a new coffee or chilling with his pup, Kobe.
You can connect with Jesse on LinkedIn.
Browse by channel

Automation
The latest on IT automation for tech, teams, and environments

Artificial intelligence
Updates on the platforms that free customers to run AI workloads anywhere

Open hybrid cloud
Explore how we build a more flexible future with hybrid cloud

Security
The latest on how we reduce risks across environments and technologies

Edge computing
Updates on the platforms that simplify operations at the edge

Infrastructure
The latest on the world’s leading enterprise Linux platform

Applications
Inside our solutions to the toughest application challenges

Original shows
Entertaining stories from the makers and leaders in enterprise tech