Perf vs gprof: Comparing software performance profiling tools

Photo by CHUTTERSNAP on Unsplash
Software profiling is used to analyze a program's behavior. Examples include how long it takes to execute a program or where in the execution it gets stuck. A program's performance is of key importance, and by using a profiling tool to determine which parts are adequate and which parts are less efficient, there is room to improve its efficiency. Software profilers are tools that assist in measuring how long the program takes to run, how long each function within it takes to run, and how memory is used in different stages.
[ Download now: Advanced Linux commands cheat sheet. ]
In this article, I'll compare two profiling tools: perf, an older, well-known, tool vs. gprofng, a newer tool (released in March 2021). I want to answer:
- Which tool is more efficient?
- Is it worth it to learn how to use a new tool when the older one works just fine?
- Is gprofng a better profiling tool than perf?
gprofng is not an entirely new tool. It was inspired by an older tool called gprof, written for GNU Binutils in 1988.
What is perf?
The perf tool is a Linux-specific, sample-based tool that uses CPU counters. Perf is a part of the Linux kernel (/tools/perf). The data sampled is displayed in the command-line interface.
Some of the features (also referred to as "events") in perf are:
- Reading hardware events such as cache misses and CPU cycles
- Reading software events such as page faults and CPU clocks
- Finding other events (by running the command
perf list):- Hardware cache events
- Tracepoint events
- Hardware breakpoints
The commands I focus on are:
perf stat: Counts the events for the duration of the programperf record: Gathers events (data) that can be used for a later reportperf report: Uses the data gathered by therecordcommand and breaks down the events to functions
[Cheat sheet: Old Linux commands and their modern replacements ]
What is gprofng?
gprofng was created because gprof is "not that very well suited for profiling
modern-world applications." For example, it can't support multithreaded programs and shared objects, which are two of gprofng features described in gprofng's manual. Other features include:
- It supports different programming languages, such as C, C++, Java, and Scala.
- It has a tailored output and filters to zoom into specific data.
- There is no need to recompile code.
Because gprofng was released recently, its support is limited to x86 and ARM64 (aarch64), while perf supports a wider range of architectures.
I will test the tool using these commands:
gprofng collect app: Collects data and creates a directory with the informationgprofng display text -functions: Displays data gathered in ASCII format but can also be shown in a browsergprofng display html -functions: Displays data gathered in a browser
To be able to answer the questions at the top of this article, I'll use the same program to compare output from perf and gprofng. The example program used in this post is taken from the gprofng tutorial, but any executable will work with both profiling tools.
[ Become a Red Hat Certified Architect and boost your career. ]
Testing with perf
I begin perf testing with:
perf stat ./mxv-pthreads.exe -m 3000 -n 2000 -t 2

Timings for the initialization phase
   elapsed time init_data = 0.051382
   cpu     time init_data = 0.051270
   system  time init_data = 0.004666
Timings for the computational phase
   elapsed time mxv = 0.753901
   cpu     time mxv = 1.504359
   system  time mxv = 0.001047
mxv: error check passed - rows = 3000 columns = 2000 threads = 2
Performance counter stats for ./mxv-pthreads.exe -m 3000 -n 2000 -t 2:
      1,565.01 	msec   task-clock:u          #  1.926 CPUs utilized
             0         context-switches:u    #  0.000 /sec
             0         cpu-migrations:u      #  0.000 /sec
        11,827         page-faults:u         #  7.557 K/sec
 5,377,230,236         cycles:u              #  3.436 GHz
 7,681,274,241         instructions:u        #  1.43  insn per cycle
 1,273,453,202         branches:u            #  813.706 M/sec
       615,857         branch-misses:u       #  0.05% of all branches

       0.812527389 seconds time elapsed

       1.549955000 seconds user
       0.012956000 seconds sys
To get the event data, you can record the events and save them into a file (by default, perf.data) by using perf record:
perf record ./mxv-pthreads.exe -m 3000 -n 2000 -t 2
Timings for the initialization phase
   elapsed time init_data = 0.052732
   cpu     time init_data = 0.052539
   system  time init_data = 0.002507
Timings for the computational phase
   elapsed time mxv = 0.883659
   cpu     time mxv = 1.692337
   system  time mxv = 0.000245
mxv: error check passed - rows = 3000 columns = 2000 threads = 2
[ perf record: Woken up 1 times to write data ]
[ perf record: Captured and wrote 0.255 MB perf.data (6638 samples) ]
Note the second-to-last line:
[ perf record: Woken up 1 times to write data ]"
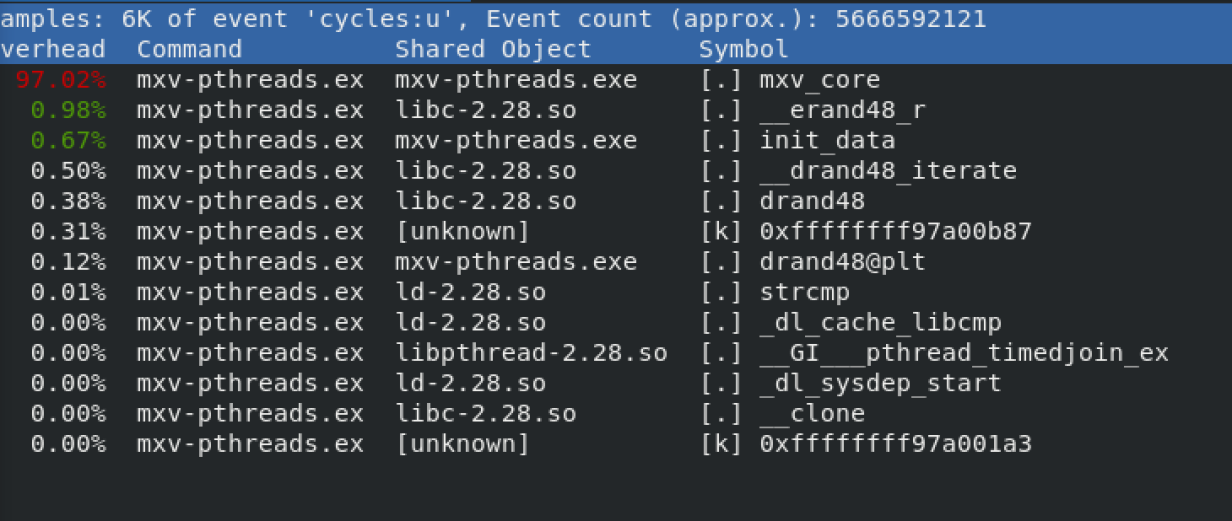
The perf.data file is a binary file, and you can use the report command to look inside it:
perf report -i perf.data
The flag -i specifies the particular file. The output shows the events with the highest impact from high to low:
- Overhead: Percentage of samples collected
- Command: Which process was used to collect the samples
- Shard Object: ELF image, or where the sample comes from
- Symbol: Function name or symbol
[ Take a Linux infrastructure planning assessment. ]
Testing with gprofng
I begin gprofng testing with:
gprofng collect app ./mxv-pthreads.exe -m 3000 -n 2000 -t 1

Creating experiment directory test.1.er (Process ID: 185038) ...
Timings for the initialization phase
   elapsed time init_data = 0.053852
   cpu     time init_data = 0.053729
   system  time init_data = 0.004606
Timings for the computational phase
   elapsed time mxv = 1.408814
   cpu     time mxv = 1.397043
   system  time mxv = 0.000000
mxv: error check passed - rows = 3000 columns = 2000 threads = 1
Compared to the perf output, there are insignificant differences in the outputs for the first part in the command perf stat and for the command gprofng collect app.
gprofng display text -functions test.1.er/

Functions sorted by metric: Exclusive Total CPU Time

Excl. 	Total	   Incl. 	Total	Name
CPU          	   CPU
sec.       %       sec     	%
1.451	 100.00    1.451   100.00   <Total>
1.391      95.86   1.391    95.86   mxv_core
0.030      2.07    0.040     2.76   erand48_r
0.020      1.38    0.060     4.14   init_data
0.010      0.69    0.010     0.69   __drand48_iterate
0.            0.   0.060     4.14   __libc_start_main
0.            0.   1.391    95.86   collector_root
0.            0.   0.040     2.76  	drand48
0.            0.   1.391    95.86   driver_mxv
0.            0.   0.060     4.14   main
0.            0.   1.391    95.86   start_thread
Note the second line of the output:
1.391 95.86 1.391 95.86 mxv_core
This shows that with both profiling tools, mxv_core is the most time-consuming function. It is shown by listing the highest impact at the top of the output:
gprofng display html test.1.er/
Processing completed - view file /home/…../display.1.html/index.html in a browser
The analysis is available in the browser:

Conclusions
Rather than a walk-through of these tools, I aimed to provide an overall view of how they work in practice and see which is easier to work with. As an objective, new user of both tools, I aimed to determine which one I prefer to work with and why. I used the simplest way of profiling a program, flat profiling. Here's what I concluded.
I found it a lot easier to learn about gprofng than perf. I found myself googling for information quite regularly when using perf. But gprofng's manual had everything I needed to know. I think gprofng's man pages have a much clearer structure than perf's. This makes it easier for a new user to follow the instructions. An experienced user might also find this format helpful but might not need a "step-by-step" tutorial for using the tool.
These tools have many more functions than what I mentioned. Refer to the man pages for a deep dive into all the flags and functionalities in these tools.
Both tools work very similarly. They use similar key commands for sampling, storing, and displaying data. Perf uses the record and report commands, and gprofng uses the collect and display commands. They have very similar outputs.
The major difference in reading the data is that the gprofng display html command allows you to see the results in something other than an ASCII view. Being able to toggle back and forth in a browser made reading the data more user-friendly to me than reading it in the command-line interface.
There is still a lot of work that needs to be done on gprofng. One of the major ones is to make the tool available in more architectures. One challenge this tool will face is to convince experienced perf users that gprofng can make data easier to read.
Can I say that either tool is more efficient? No, both work pretty similarly.
[ Create an organizational culture that fosters innovation. Download The IT executive's guide to building open teams. ]
Is it worth adopting gprofng?
Is it worth it for experienced users to learn how to use gprofng? Definitely; I think that the HTML visualization makes it much more pleasant to read. According to the gprofng team, they're also working on a graph visualization. This will make it even easier for the user to read the data.
Is gprofng superior to perf? No, but I think it is a tool in construction. Gprofng is modern, new, and has updates yet to come. For now, perf is more established in the community, and gprofng needs more development to take perf's place.


Yara Ahmad
In 2022, after finishing her studies in computer engineering at Örebro University - Sweden, Yara began working as an associate software engineer for Red Hat. More about me
Navigate the shifting technology landscape. Read An architect's guide to multicloud infrastructure.
Related Content


OUR BEST CONTENT, DELIVERED TO YOUR INBOX