Using ifstat for Linux network statistics

As a data replication engineer, I often saw offsite replications fail for customers due to a networking issue. Many times, large customers had a dedicated replication interface configured in their environment that needed to be tested. A great command for doing this is ifstat. Don't take my word for it though, let's explore the ifstat command to see what it can do for you.
What is it?
The ifstat command prints network interface statistics. The interface keeps records of the previous data displayed in history files. By default, it only displays the difference between the last and current calls. The default location of the history files is /tmp/.ifstat.u$UID. That location can be changed by altering the IFSTAT_HISTORY environment variable. See the man page for more details.
Syntax
The structure for this command is a basic command option object syntax that even beginners will find familiar.
ifstat [Options] [Interface]
I have a practical example below. I ran the command with no options or interfaces specified. There is also an example where I ran ifstat against a specific interface: enp0s3. Let's break down what we see to better understand the output of this tool.
Breakdown of output
Let's start by using the command with no options specified.
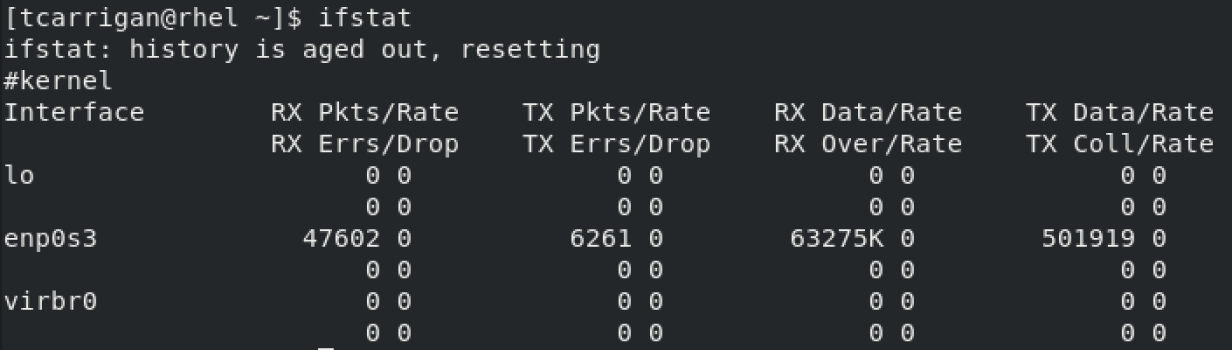
As you can see above, there are five columns of data per interface, with each interface having two rows. The first column is the interface name. The remaining columns contain two data fields each.
You see packets received and rate in the RX column, as well as any errors or drops on those packets. In the TX column, we have packets transmitted and rate, as well as errors and drops. After the packet columns, we change the unit of measure to data sent and received. This value is measured in kilobytes. We have data received and rate, as well as data transferred and rate.
Note: This output is from a VM with little network activity and only one active interface.
Options to know
Here are a few particularly handy options for ifstat:
-a, --ignore - Ignores the history file
-d, --scan=SECS - Samples stats every x number of seconds
I have included an example of the -d option, as it can be a bit confusing.
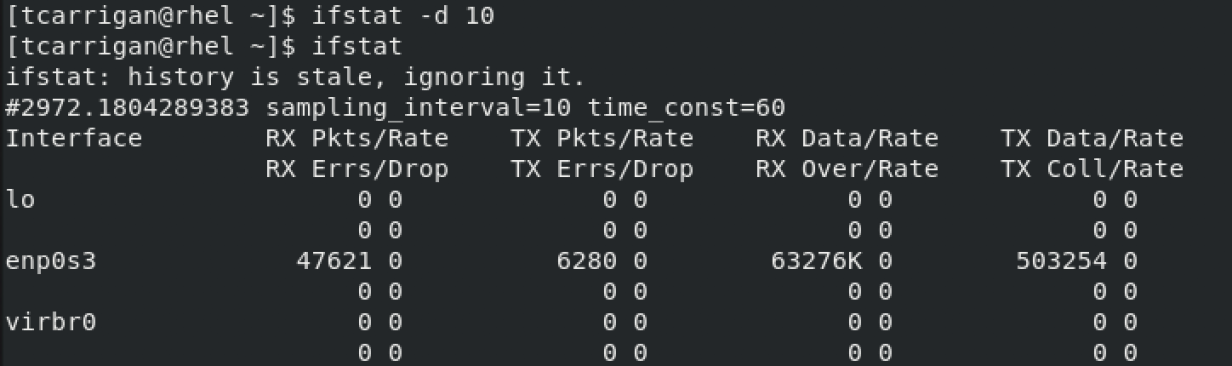
Note: The sampling_interval is 10 seconds.
-e, --errors - Shows errors
-n, --nooutput - No output is displayed—only updates history file
-r, --reset - Resets history

-s, --noupdate - Does not update the history file
-t, --interval=SECS - Adds a timestamp to each entry
-z, --zeroes - Shows entries with no activity
-v, --version - Shows the version of the program
-h, --help - Shows a summary of options
Summary
We took a look at ifstat and some of its fundamental options. It can be handy to view the throughput of an interface and any transmitting or receiving errors that you may have. The ifstat command was helpful for troubleshooting network issues for my data replication jobs, for example. There are other options and variations on options that may be practical for your use cases. However, this is enough to get you started. I have been looking into different statistical commands lately, and I will be writing on the nstat command soon. Be sure to keep an eye out for that.
[ Want more for your network? Download a free ebook on network automation with Ansible. ]

Tyler Carrigan
Tyler is the Sr. Community Manager at Enable Sysadmin, a submarine veteran, and an all-round tech enthusiast! He was first introduced to Red Hat in 2012 by way of a Red Hat Enterprise Linux-based combat system inside the USS Georgia Missile Control Center. More about me
Try Red Hat Enterprise Linux
Download it at no charge from the Red Hat Developer program.
Related Content