Monitor your network switches with this open source tool

A network is only as good as its switches. If a switch is performing poorly or fails, the impact is immediately noticeable by users. Monitoring switches with Simple Network Management Protocol (SNMP) is one way to detect (and try to prevent) network performance problems.
SNMP monitoring provides good insights into a device's CPU and RAM utilization and an individual port's bandwidth and usage. With Power over Ethernet (PoE) switches, you can monitor the PoE budget for an entire switch or for the traffic on individual ports.
One challenge with switch monitoring is the network's port utilization: Which ports are free and which are in use? A normal port scan may not show interfaces that are offline during the scan.
Monitoring all your switches provides an overview of your interfaces and helps detect problems such as broken patch or installation cables, dirty fiber optics, configuration errors such as duplex mismatching, or unauthorized connections to unused ports.
Checkmk is an open source monitoring tool that automatically monitors all interfaces using a rule-based approach. You can set it up in just a few steps.
Prerequisites
For this tutorial, I'm using the Checkmk Raw Edition, which you can download for your Linux distribution or pull from its Git repository. The Checkmk Raw Edition is entirely open source and combines professional IT monitoring with the flexibility of open source solutions.
Before I begin, I'll assume you've already added a switch as a host to your monitoring, and you can monitor it using SNMP. If you are not sure how to do that, follow this getting started tutorial or check out this video.
For simplicity, I'm using one switch in this tutorial. Checkmk works with rules, so the procedures in this article work for one switch or thousands.
[ Learn more about network management with this helpful guide. ]
Configure your switches
For this tutorial, you must name the most important ports using the configuration interface on each switch. Having a uniform naming convention makes network administration much easier. For example, I name the uplink port to another switch sw06. I name a firewall fw-1. You can use any naming scheme, as long as it's consistent, doesn't consist solely of numbers, and is readable by humans.
Ports generally don't have names, so in your monitoring environment, you probably have a list of interfaces consisting of numbers or technical descriptions, such as interface 52802. By renaming them to uplink sw06 or fw-1, you can immediately see your most important ports and their functions in order to distinguish them from a normal access port.
Create a Host tag group
Even when you name ports, Checkmk sometimes does not take the altered names into the monitoring. This is because most vendors use the SNMP table Alias for the interface names, but a few use the table Description. You fix this with Host tags, which Checkmk organizes into Host tag groups. This allows you to restrict Checkmk rules to hosts with or without a specified tag.
The first step is to create a Host tag group so that Checkmk uses the correct table. Perform the following steps on the Checkmk web interface:
- Under Setup > Hosts > Tag, click Add tag.
- In the next window, navigate to Basic settings. In the Tag group ID field, enter if_alias_desc. In the Title field, enter Interface: by Alias/by Description.
- Under Tag choices, click twice on the button Add tag choice.
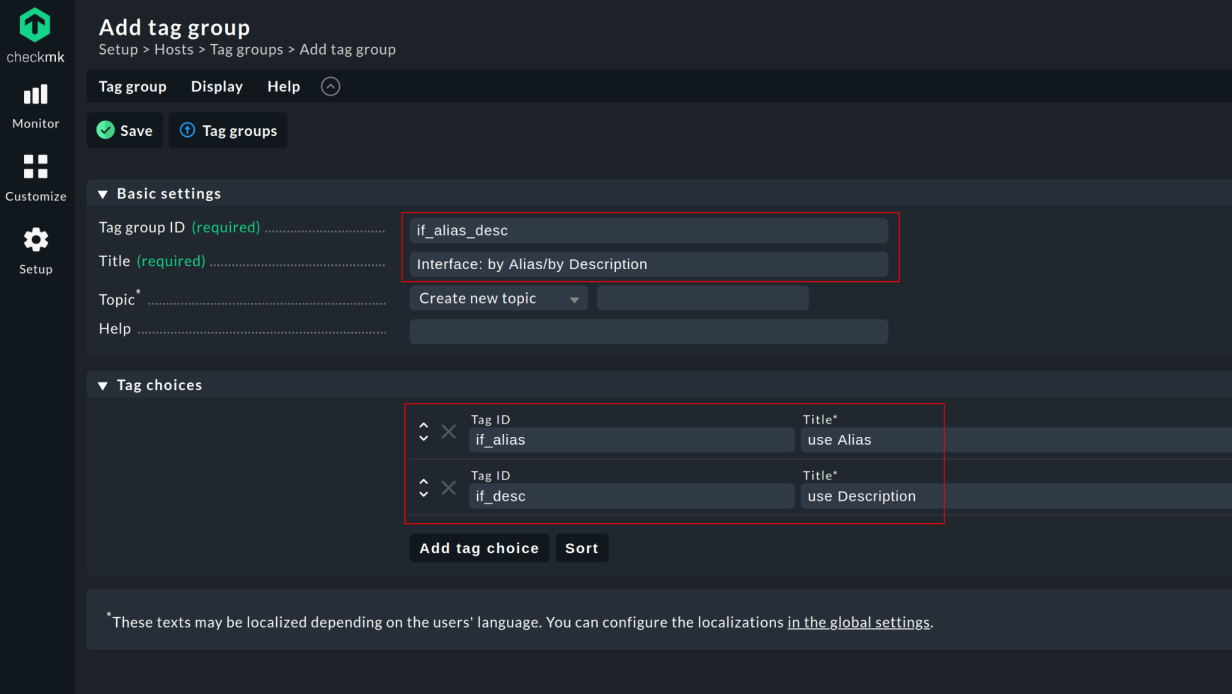
The Tag choices are the selection options for this group.
The first Tag choice becomes your default setting for Checkmk, since most devices and vendors use the Alias table. Checkmk applies the rule to all hosts with the host tag use Alias. For this, use if_alias as the internal Tag ID and use Alias as the Title.
The second Tag choice is for the Description table. Set if_desc as the Tag ID and use Description as the Title.
Save the tag group. It appears in the overview with the selected ID if_alias_desc.
[ Network getting out of control? Check out Network automation for everyone, a free eBook from Red Hat. ]
Discover and explore network interfaces
For Checkmk to apply the tag group to ports, you must connect it to the rule that affects how Checkmk discovers network interfaces:
- Click on Setup and enter interface in the search field.
- Under Service discovery rules, select the Network interface and switch port interfaces rule.
- Click on Create rule in folder: Main directory.
- In Network interface and switch port discovery, leave the checkbox before Configure discovery of single interfaces checked, and select Use alias in the Appearance of network interface drop-down menu.
- Under Conditions for this rule to apply, select the Match all interfaces setting.
- Under Conditions, set Interface: by Alias/by Description.
- Click Save to implement the changes.
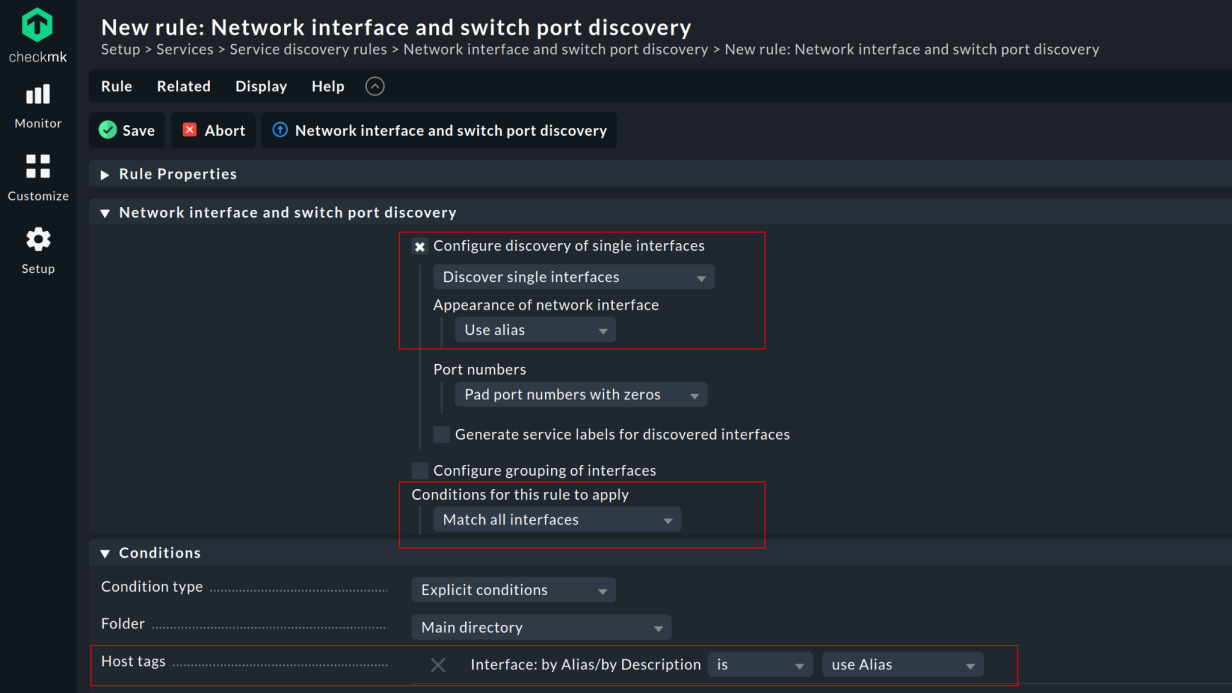
You've created a rule that applies the host tag use Alias to network devices. This is the standard for most manufacturers and devices. In addition, because you specified the Match all interfaces option, Checkmk adds VLAN interfaces and ports that are offline while discovery is running.
Not all devices use the Alias table, so you must create the same rule for the Description table. However, you don't have to enter all the settings again. Instead, clone the rule you just created by clicking on the icon next to the pencil in the overview list after saving the rule. (You get there when searching for the rule in the Setup again.) Now you just have to make a couple of minor adjustments:
- In the drop-down menu under Appearance of network interface, change Use alias to Use Description.
- Under Host tags, switch from use Alias to use Description.
- Click Save.
- Click on the yellow exclamation mark next to 3 changes to activate the changes.
Prepare for exceptions
If you don't see the expected data in your monitoring, there is a simple reason for it: You might be monitoring the wrong field. Some manufacturers use the Alias field in the SNMP table to describe interface names, while others use the Description field. You have to take this into account in your monitoring.
At this point, you have configured Checkmk to apply use Alias by default for port discovery. You have not yet assigned any host tags, so Checkmk applies your defined default for the discovery of ports on all hosts without a tag.
For the description table rule to apply to these switches, you must assign the use Description host tag to the hosts that do not use the alias table.
If there are only one or two switches that require this additional configuration, navigate to Custom Attributes and go to the Interface: by Alias/by Description section. Change the Host Properties to use Description.
If a number of switches require this configuration, the easiest way to set their Custom Attribute is to use folders. Folders are a simple way of grouping hosts in Checkmk, because all hosts in a folder inherit the folder's attributes, without you having to configure the hosts individually. To do so:
- In Setup, go to Hosts in the Hosts section.
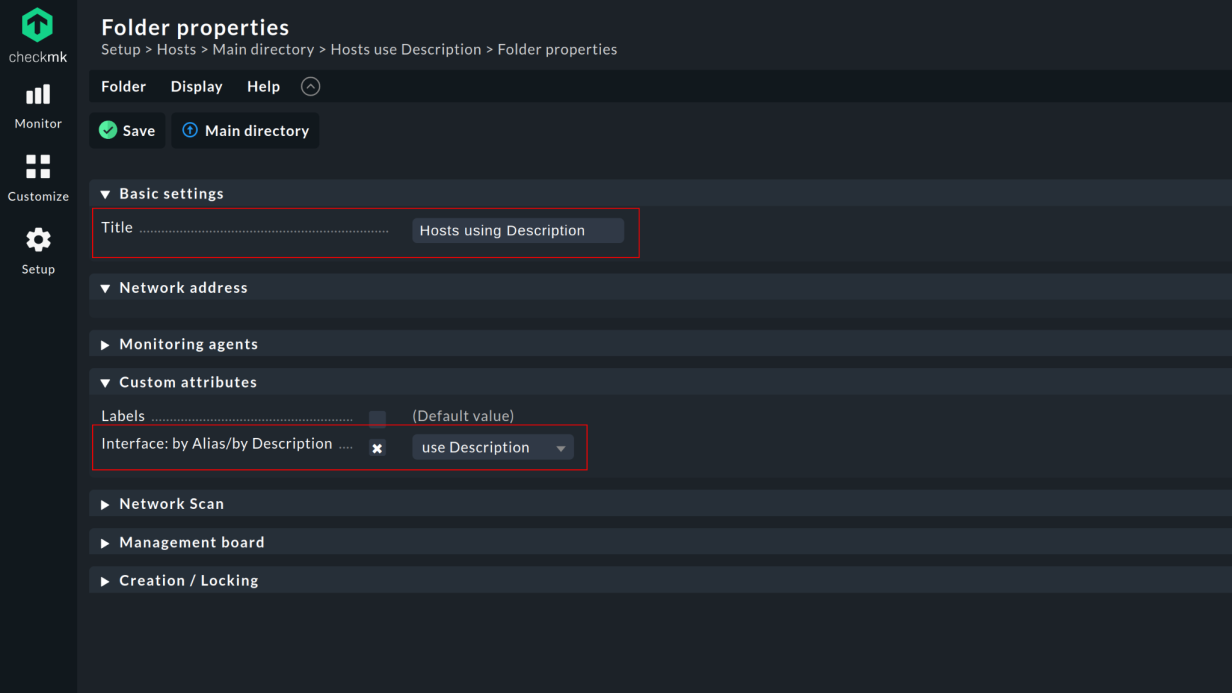
- Click on Add folder and enter a Title, such as "Hosts using Description."
- Under Custom attributes, activate the Interface: by Alias/by Description checkbox.
- In the drop-down menu, change use Alias to use Description and click Save.
- In the following view, you can see the created folder and all hosts of your monitoring. You can mark the affected switches in the host list by activating the checkbox.
- Click on the Move to folder icon (the fourth icon from the left), and select the folder you just created.
- Click Activate changes.
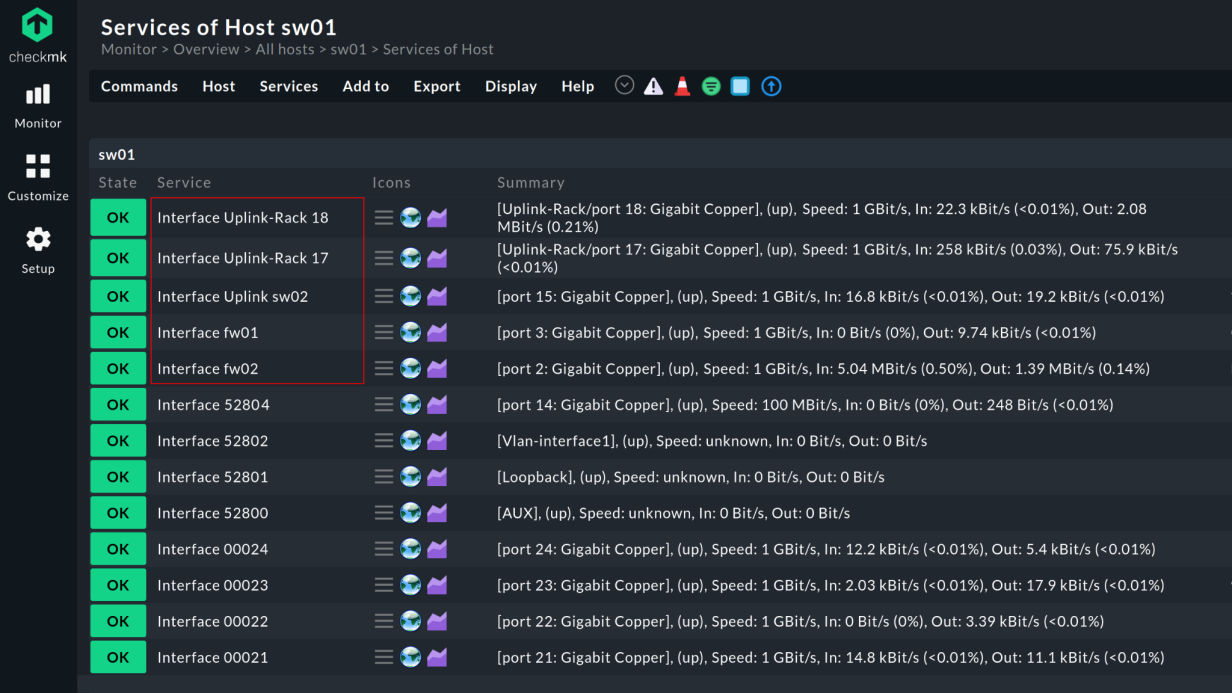
Now, all interfaces are correctly named after the next measurement interval.
[ Free cheat sheet: Get a list of Linux utilities and commands for managing servers and networks. ]
Silence access ports
Checkmk displays the names you defined for your most important ports. The access ports still have the manufacturer's standard designation.
Access ports regularly change their status, depending on whether an active device is connected or not. This can become annoying during monitoring.
Checkmk comes with threshold values for monitoring statuses and metrics. If an access port goes offline, its status changes to CRIT. The monitoring interface then becomes overloaded with notifications from access ports with critical status, even though these ports are functioning normally.
You can modify this behavior using another rule that specifies that Checkmk should ignore variations in the access ports' status and speed and, in doing so, use the ports' names:
- In Setup, search for interface again.
- Under Service monitoring rules, select the Network interfaces and switch ports rule.
- Click on create rule in folder: Main directory.
- Activate Operation speed and select ignore speed in the drop-down menu.
- Enable Operation state and select the Ignore the operational state submenu item.

This rule tells Checkmk how to handle newly discovered interfaces. The previous default settings specified that Checkmk ignores status and speed changes for newly discovered interfaces. To make sure that this doesn't apply to all interfaces, and only to the access ports desired, you need to modify the rule by using its default name.
For most interfaces, the default name consists of numbers, which you can easily capture with regex. This is also the reason it's important to give meaningful (and human-readable) names to the most important ports, rather than choosing names consisting of pure numbers.
To complete the rule, enter the regex \d+ into the Port field under Conditions.

This regex matches all port names that start with a number. Should the port name for one of your switches differ from the standard pattern, add the corresponding expression to the regex. For example, I add the term "Gigabit Ethernet."
When you're finished, click the Save button and activate the changes.
Now you've configured all of the network interfaces for your network monitoring. You are now able to see at a glance which ports are the most important on your switches. Should the status or speed of these ports change or an error occur, Checkmk displays these ports as CRIT in the monitoring interface. Checkmk does not change the monitoring status if the status or speed of an access port varies. You do receive a notification when an error occurs.
Add the port background in your monitoring
This configuration results in meaningful names for your switch, firewall, and network interfaces and all other devices in your infrastructure.
You can use Checkmk to get even more detailed knowledge of your switch ports and use this information for port management. To do this, make one small modification:
- Find inventory in the Setup menu.
- Under Hardware/Software Inventory, select the Do hardware/software inventory rule.
- Create a new rule in the Main directory.
- Enable the Status data inventory checkbox and select Do status data inventory from the drop-down menu.
- Save the rule and activate the changes.
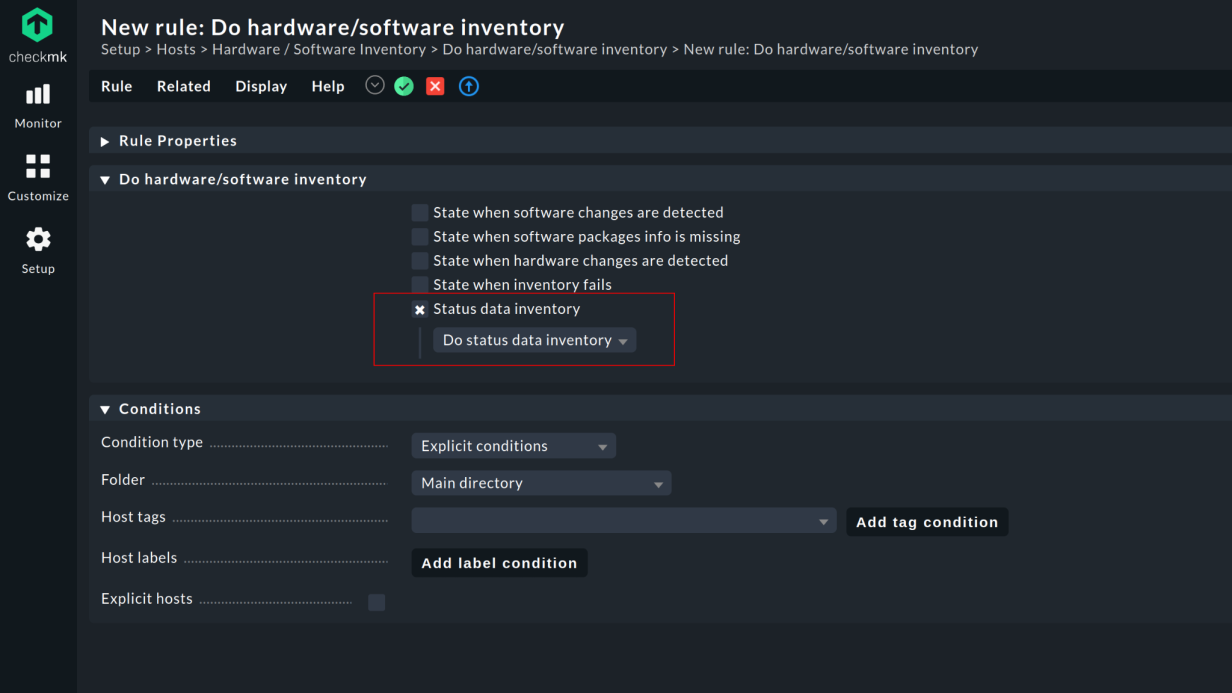
This configures Checkmk to perform an inventory of the status data to detect new inventory entries the next time you check your switches. This provides you additional information about your ports to help you manage those ports.
The inventory can be accessed through the action menu in the Host view for a switch:
- Open the action menu for the service CHECK_MK HW/SW inventory.
- Click on Show Hardware/Software Inventory of the host.
- Go to Networking to get an overview of all ports.
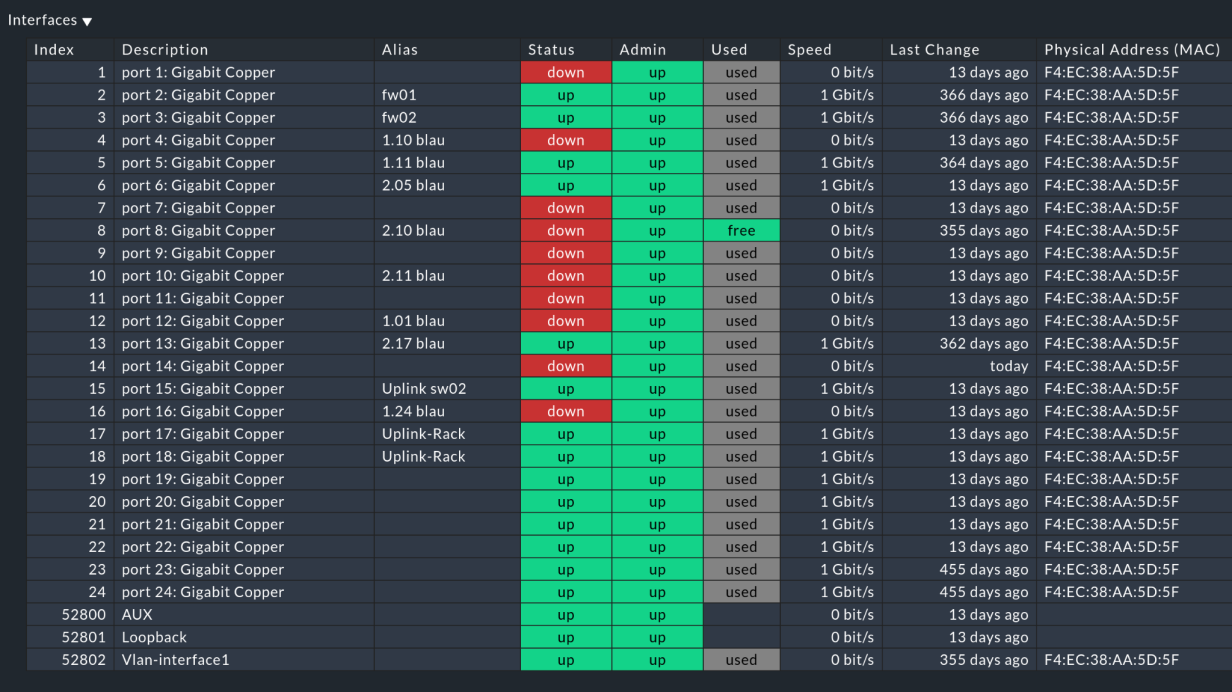
You now have a complete inventory of your ports under Interfaces. The overview shows you which ports are up or down and which are in use.
You can also see whether an interface that's currently down is in use. By default, Checkmk remembers the Used Status of a port for 30 days. Should a port stay down for longer than that, Checkmk marks it as free again. You can customize the time period in the Parameters of switch port inventory according to your own needs.
Monitor your switches
You have set up comprehensive switch monitoring that gives you an overview of the load and performance of your devices and your network, including the status of all network interfaces. It also enables you to see which ports are free, which are in use, and when an error occurs.


Timo Scheibe
Timo is a former IT journalist who has written for different IT magazines such as the German edition of CRN and LANLine. Through his writing, he found his passion for open source software and IT monitoring. In 2020, he joined tribe29, the company behind the monitoring solution Checkmk. More about me
Try Red Hat Enterprise Linux
Download it at no charge from the Red Hat Developer program.
Related Content