
5 ways to monitor and troubleshoot your automation
Red Hat® Ansible® Automation Platform is a powerful tool for creating, building, and scaling automation across your organization. As your automation expands, it is essential to track job performance and respond quickly when problems occur so you can optimize your efforts.
- Consider these questions about your organization’s automation approach:
- Can you see which jobs are running and know whether they have completed successfully— or failed?
- Do you know which clusters are approaching end-of-life or a license capacity limit?
- Are there vulnerabilities that might lead to performance degradation or outages that you need to address?
Two powerful but often overlooked tools to help answer these questions and optimize your automation program are already bundled into your Ansible Automation Platform subscription: automation analytics and Red Hat Insights for Red Hat Ansible Automation Platform.
Automation analytics provides full visibility into the performance and return on investment (ROI) of your automation, helping you check and troubleshoot the status of your automation. Red Hat Insights provides actionable metrics to help identify and resolve operational and security issues across your Ansible-managed ecosystem.
Here are a few examples of how automation analytics and Red Hat Insights can help you monitor and optimize your automation more efficiently.
1. Track automation jobs
Automation jobs can fail for many reasons. The job explorer dashboard helps you quickly visualize why a failure occurred, how to fix the issue, and how to adapt your automation to avoid potential issues in the future.
You can identify:
- Which jobs were successful and which failed.
- Which teams ran which playbooks.
- When each job failed.
- The cluster(s) where each job ran.
- Which user ran each job.
- Which playbooks are run most frequently.
- Historical trends over up to two years.
2. Troubleshoot issues faster
The advisor and remediations services help you proactively identify performance and security issues and quickly assess which systems (automation controller, Ansible automation hub, or automation services catalog) are impacted. Examine the detail to see recommendations and instantly generate a playbook to resolve the issue. You can respond to:
- Expired licenses that require renewal before upgrading to the latest version of Ansible Automation Platform.
- Configuration settings that have exposed the system to external access.
- Decreased system performance that requires best practices to be applied.
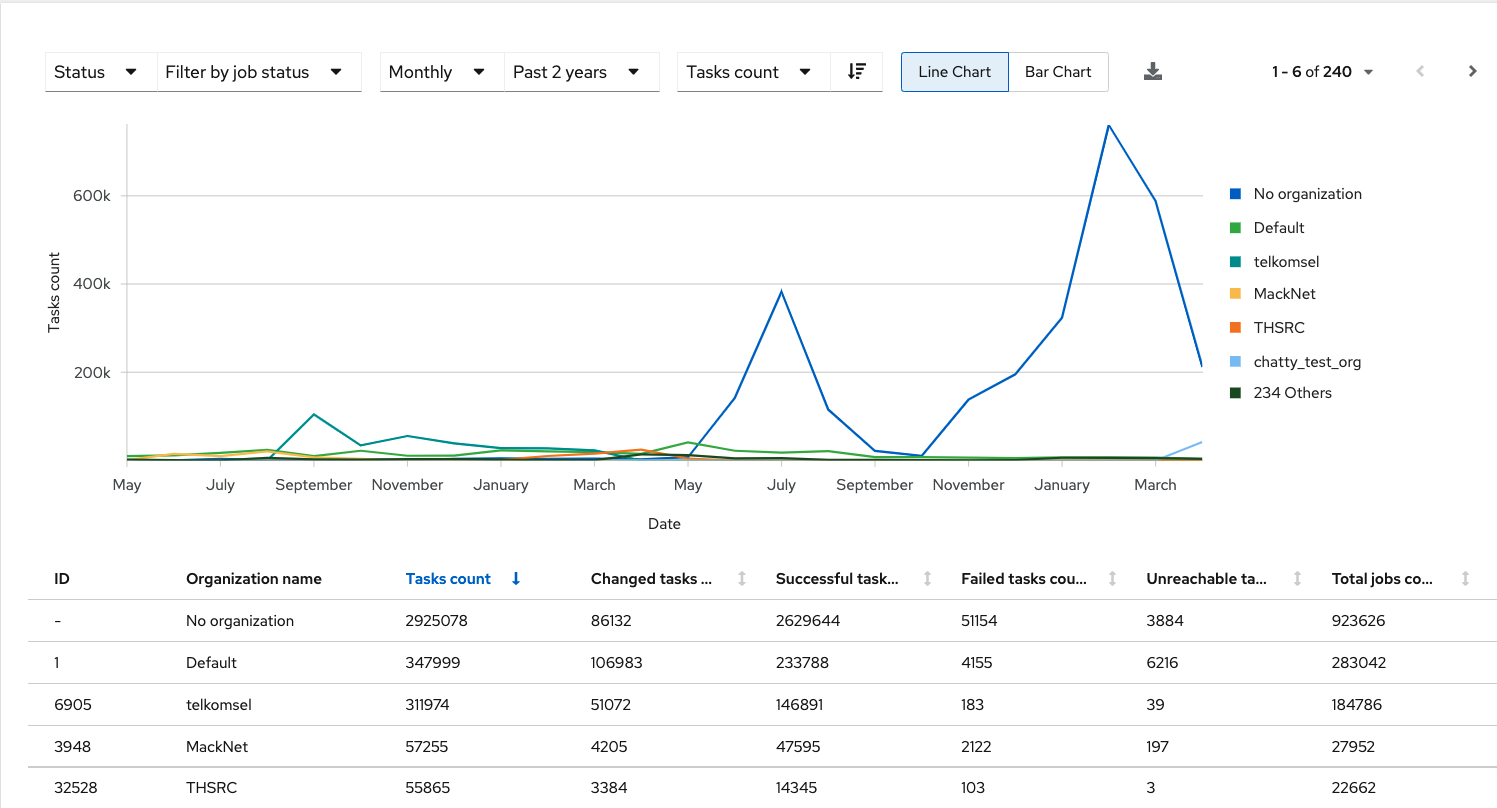
3. Run reports to monitor automation across clusters, hosts, and teams
Red Hat’s most active automation users use the reports module to measure and optimize their automation. This module includes our most-requested dashboards from other Ansible Automation Platform customers, giving you the exact data and metrics you need to manage your automation efforts. You can:
- Visualize the changes made by each job template.
- Review the host and task status to identify any bottlenecks or problems with templates.
- Evaluate module usage by different teams and track your most-used modules.
- View the number of hosts changed by a job template within a specified time.
- Find discrepancies in the host change rate at a particular time.
- Learn why hosts were unreachable at a particular time.
- And more, with new reports added periodically.
All reports can be downloaded in PDF format and shared via email to help you better communicate the performance and value of your automation investment.
Key terminology
This overview refers to several key automation concepts:
- A cluster is an installation of Ansible Automation Platform.
- A host is an IT asset like a server, router, or storage device.
- A task is a unit of automation run against a host.
- A template or playbook is a collection of tasks that run together to form an automation workflow.
- A job is an instance of a template that is run against a set of hosts.
4. Identify inconsistent configuration across systems
One of the most tangible benefits of automation is ensuring consistent configuration across disparate systems.
With the drift tool, you can compare two more systems against each other or use configuration baselines to ensure that all your automation infrastructure matches your production standard. Compare memory, architecture, and operating system (OS) version to see where patches or upgraded software are required.
5. Receive proactive notifications
Automation frees up time so you can focus on more strategic projects. Notifications help you maintain your focus by only alerting you to critical issues that need attention, such as:
- A cluster with a failed playbook.
- A cluster is approaching or has reached a capacity limit.
- An expired cluster license.
- A system that has reached end of life.
- Cluster data that is not being collected.
Get started
Subscribers using Ansible Automation Platform 2.1 (and earlier):
Subscribers using Ansible Automation Platform 2.2 (or later):
- Activation of data collection is activated during deployment.
Not yet an Ansible Automation Platform customer? Test drive it now with a free 60-day trial.