OpenShift ships with default reaction time for events, for example in case there is an increase in network latency between control plane and worker node. Kube controller manager will wait 40s by default before declaring the worker node is unreachable. For certain use cases, 40s is too fast of a reaction time and might cause unnecessary churn in the infrastructure. Also, once a node is deemed as unhealthy it gets tainted and if pods are part of a deployment set then they are scheduled somewhere else based on their replica count.
By default it takes 300s to kick in and ask the scheduler to schedule the pod. For certain use cases 300s might be too long to start the application. To address all the above concerns we have released WorkerLatencyProfiles in OCP v4.11. Customers can choose between two additional profiles viz. "Medium Update Average Reaction“ or “Low Update Slow reaction“ apart from the Default profile, based on the network conditions of their cluster environment and their application needs.
|
Component |
Flag name |
Default value |
MediumUpdate AverageReaction |
LowUpdate SlowReaction |
|
Kubelet |
node-status-update-frequency |
10s |
20s |
1m |
|
Kube API Server |
default-not-ready-toleration-seconds |
300s |
60s |
60s |
|
Kube API Server |
default-unreachable-toleration-seconds |
300s |
60s |
60s |
|
Kube Controller Manager |
node-monitor-grace-period |
40s |
2m |
5m |
Following scenario showcases the practical usage of the worker latency profile feature on an OpenShift 4.11 Cluster.
Updating the Worker Latency Profile
The “nodes.config” custom resource “cluster” is modified as below to update the worker latency profile in an OpenShift 4.11 cluster to “MediumUpdateAverageReaction”
One can verify if the profile is reflected by validating the kubelet, kube-controller-manager & kube-api-server configurations as captured below.
“nodeStatusUpdateFrequency” parameter of the kubelet on each of the worker nodes is updated to “20s”
“node-monitor-grace-period” parameter of the kube-controller-manager on each of the master nodes is updated to “2m”
“default-not-ready-toleration-seconds” , “default-unreachable-toleration-seconds” parameters of the kube-api-server present on each of the master nodes are updated to “60s” each.
Simulation of a simple pod creation, Node Unreachability:
A simple nginx pod with the below configuration has been created.
Note: A deployment can also be created here so as to observe a new pod on a new node when the affected pod is terminated due to node unreachability.
[svanka@svanka wlf]$ cat simple-pod.yaml
apiVersion: v1
kind: Pod
metadata:
  name: nginx
spec:
  containers:
  - name: nginx
    image: nginx:1.14.2
    ports:
    - containerPort: 80
It is observed that the pod is created on a worker node and the kubelet service on that particular worker node has been stopped by making a note of the timestamp as follows.
[svanka@svanka wlf]$ oc get pods -owide
NAME                                           READY   STATUS      RESTARTS   AGE     IP            NODE                                        NOMINATED NODE   READINESS GATES
nginx                                          1/1     Running     0          11m     10.129.2.6    ip-10-0-146-74.us-east-2.compute.internal   <none>           <none>
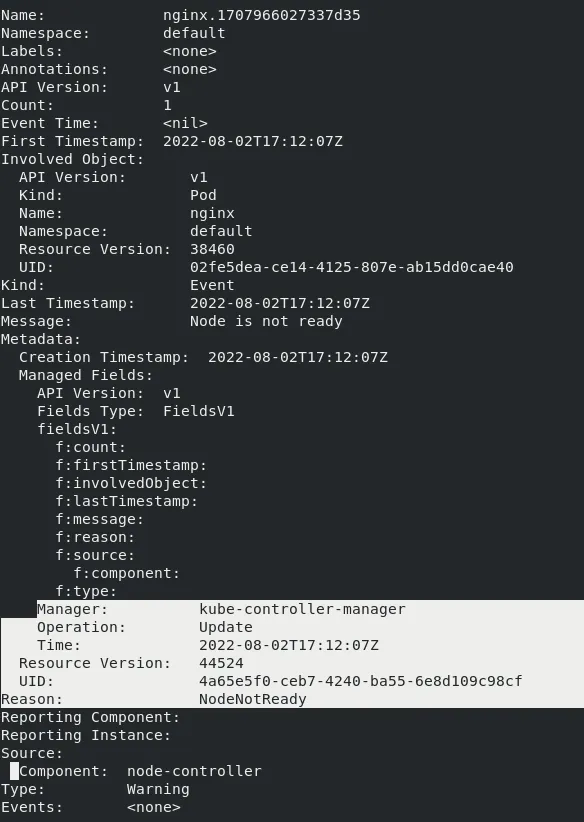
The events related to the “nginx” are collected and a “NodeNotReady” event is updated by the kube-controller-manager as follows after around “2m” interval, which is the “node-monitor-grace-period”
After the “60s” time interval which is the “default-not-ready-toleration-seconds”, the pod has been marked for deletion and entered the “Terminating” state. An event is also observed.
In case of a deployment, a new pod would have been created on another worker node as mentioned in the above note.
Summary
- The pod termination in the case of “MediumUpdateAverage” reaction worker latency profile took around “3m” time interval (node-monitor-grace-period + default-not-ready-toleration-seconds) where as it takes around “5m40s”, “5m60s” in the case of “Default” and “LowUpdateSlowReaction” worker latency profiles respectively.
- We can observe, the Default profile’s reaction time is in between the Medium and the Low profile reaction times.
- The “Default” profile works for most of the cases and depending on the network latencies, high pod densities, high disk i/o, etc. the desired profile can be set.
About the authors
Browse by channel
Automation
The latest on IT automation for tech, teams, and environments
Artificial intelligence
Updates on the platforms that free customers to run AI workloads anywhere
Open hybrid cloud
Explore how we build a more flexible future with hybrid cloud
Security
The latest on how we reduce risks across environments and technologies
Edge computing
Updates on the platforms that simplify operations at the edge
Infrastructure
The latest on the world’s leading enterprise Linux platform
Applications
Inside our solutions to the toughest application challenges
Original shows
Entertaining stories from the makers and leaders in enterprise tech
Products
- Red Hat Enterprise Linux
- Red Hat OpenShift
- Red Hat Ansible Automation Platform
- Cloud services
- See all products
Tools
- Training and certification
- My account
- Customer support
- Developer resources
- Find a partner
- Red Hat Ecosystem Catalog
- Red Hat value calculator
- Documentation
Try, buy, & sell
Communicate
About Red Hat
We’re the world’s leading provider of enterprise open source solutions—including Linux, cloud, container, and Kubernetes. We deliver hardened solutions that make it easier for enterprises to work across platforms and environments, from the core datacenter to the network edge.
Select a language
Red Hat legal and privacy links
- About Red Hat
- Jobs
- Events
- Locations
- Contact Red Hat
- Red Hat Blog
- Diversity, equity, and inclusion
- Cool Stuff Store
- Red Hat Summit


