When I started working in the security field over 20 years ago, CVE (Common Vulnerabilities and Exposures) had just been created. In 1999, MITRE, a US-based Federally Funded Research and Development Corporation (FFRDC) was established to advance national security, creating the CVE program as a way of cataloging vulnerabilities so that any single vulnerability could be distinguished from another. It was a few years before it gained wider adoption and longer yet to be considered more or less mainstream (although the truth is, even today, not every vulnerability has an associated CVE, nor is every CVE an actual vulnerability!). It was certainly miles ahead of what we used to do; back then if there were two vulnerabilities in sendmail you had to refer to them by the vulnerable function or, if you were lucky, a Bugtraq ID (or BID) had been assigned.
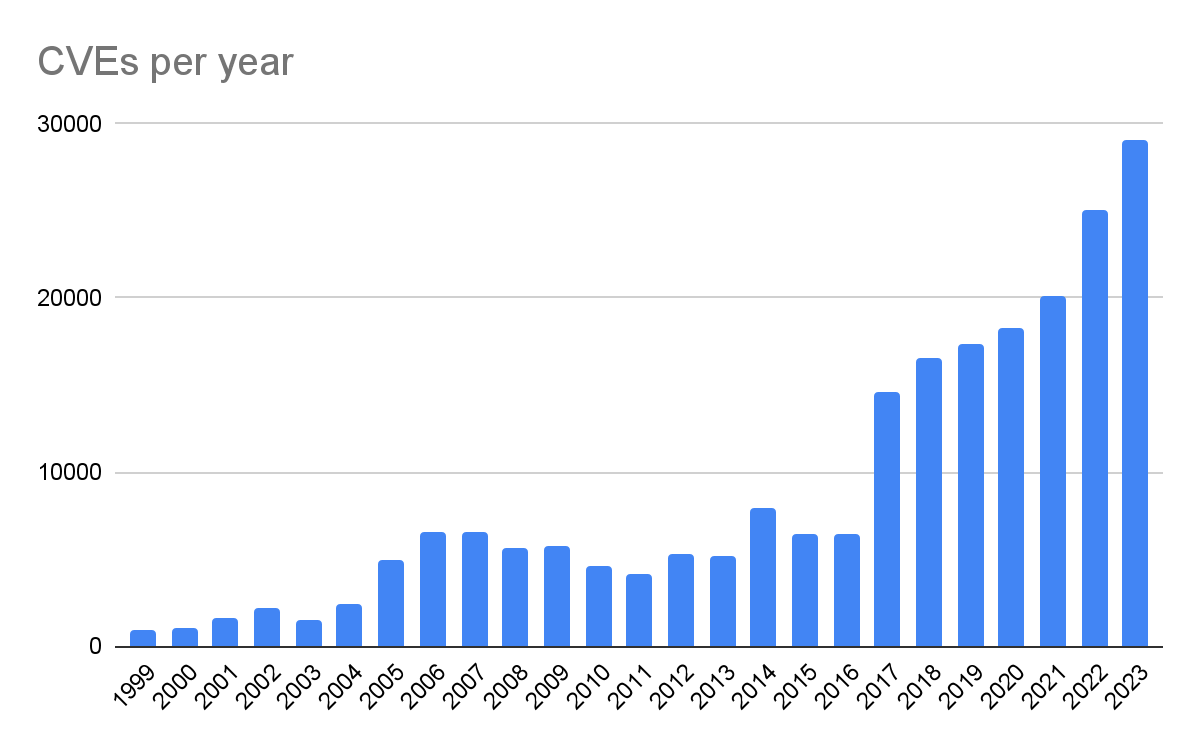
It’s worth looking at the number of vulnerabilities that were being discovered back then. In 1999, there were 894 vulnerabilities in the CVE database. For 2023 that number is over 29000 entries. You can see that progression with the CVE Details data by year. That’s more than a 3100% increase over 24 years. What was 74 vulnerabilities per month, on average, is now over 2,400 per month. That’s a significant increase!
Now this can be attributed to a number of factors, but these are likely the most significant: the sheer volume of software due to the swift, exponential growth of advanced and complex technology and the digital transformation of data and processes that were once manual. If we compared just lines of code from then to now, the increase would be staggering and still wouldn’t account for the amount of changed code. There have been some attempts to quantify just how much code has been written: Medium estimates 93B lines of code each year, and a visualization of lines of code in software shows just how complex software has become. The Linux kernel itself, based on the Linux Foundation’s 2020 Linux Kernel History Report shows how much code is created and changes in just one (albeit very complex) piece of software. And what this code now processes is increasingly larger and more complex; in short we are handling more data, and more important data, than ever before and creating new technology to manage it more efficiently.
Now here’s where things become more interesting, at least to me. If we refer back to NISTIR 5153, published in 1993, there appears to be no explicit mention of patching or updating software. Most of it addresses restrictions around the use of software, proper configuration, and monitoring. At some point, patching systems became a best practice – and it is! If updated software is available, it is absolutely the prudent thing to apply the software update, particularly when it fixes a security issue. This is common knowledge and is based on the premise that risk is reduced when a security vulnerability is patched.
Vulnerability exploitation
There are four general states of a flaw in software: not affected, affected but not vulnerable, vulnerable, and exploited. A flaw might affect a particular version of software and that same software, before it was introduced or after it was fixed, is not affected. The software might have the flaw present in the code, but is not used in a way that makes it vulnerable – this is pertinent in software with dependencies that, while including a dependency with a flaw, might not use it in a way that makes the dependent software vulnerable. Of course, the software could very well use that code in the particular way that makes the flaw vulnerable to exploitation, and the final state is the software is known to be actively exploited.
More often than not, flaws are discussed in terms of either affected or vulnerable – in other words only whether or not the vulnerable code is present. What isn’t widely discussed are exploitation rates. Given a piece of vulnerable software, what is the probability that it will be exploited? Demonstrably these are quite low and we can validate that with public information. One great source of information is CISA’s KEV or Known Exploited Vulnerabilities list. This list is not exhaustive, but it should be representative, given it’s created by the US Cybersecurity and Infrastructure Security Agency. I’ll make the assertion that it is as trustworthy, if not more so, than the NIST National Vulnerability Database, another US government database. And since most scanning tools and users trust the NVD implicitly, we’ll extend the same courtesy to the KEV.
VulnCheck provided a great breakdown of the KEV in their 2022 Exploited Vulnerability Report and I’ll highlight some of the specific findings here. Read the report for all the details though, it’s not long and worth reading.
From 2002 to 2021 there were 311 known exploited vulnerabilities on the KEV list. According to CVE Details, in that same timeframe, there were nearly 163,000 CVE’s assigned, most (but not all) being vulnerabilities.
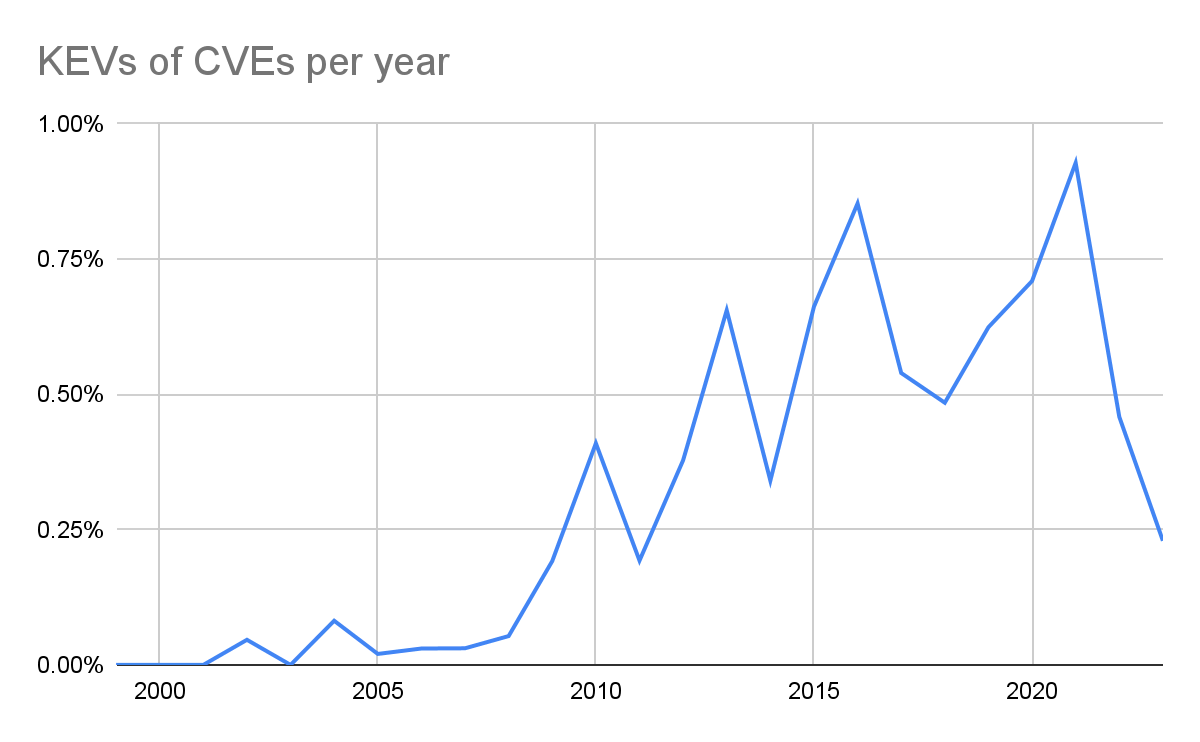
2022 had a significant leap in new KEVs by adding 557 to the list. 2022 also had 25,082 CVEs added. At a first glance, we could assume an exploitation rate of 2.2% but only 93 of those 557 were for a 2022 CVE, or 17% of all the KEVs added that year. That means the actual exploitation rate of a vulnerability, exploited in the same year it was found, was actually 93 out of 25,082, or 0.37%. The majority of the KEVs listed in 2022 were for vulnerabilities made public in prior years, even as far back as 2002. Incidentally, this highlights the importance of applying available patches and upgrading software when patches are available!
CISA got serious about the KEV in 2021 due to their Binding Operational Directive 22-01. A lot of what was added in 2022 were for things we’re pretty sure were being exploited well before then. Either way, the large jump in 2022 isn’t the significant part (although it’s great to see the additions). The significance is that only 0.37% of reported vulnerabilities were known to be exploited within the same calendar year. CISA acknowledges in this same report that “based on a study of historical vulnerability data dating back to 2019, less than 4% of all known vulnerabilities have been used by attackers in the wild.”
Interestingly, a joint paper was released by a consortium, including CISA, NSA and FBI, advising about the top exploited vulnerabilities in 2022. The paper highlighted that exploitation of unpatched systems, when a patch was available, was the top contributor to security events. They note that, of the more than 25,000 vulnerabilities reported in 2022, only five are within the top 12 software vulnerabilities exploited during the same calendar year. The rest? Older vulnerabilities that had patches available and were not applied. In the top 12, the only open source software was Log4j (rated Critical). Of the other 30 listed as commonly exploited, only seven are open source (affecting Spring Cloud (Critical), Zimbra (Important and Moderate), Apache httpd (Important) and Log4j (Moderate)). Of these 42, only eight affected open source, and only two of them were rated Moderate.
For Red Hat products specifically, and as per the 2022 Red Hat Product Security Risk Report, we saw exploitation of 0.4% of the total vulnerabilities affecting Red Hat products, the bulk of these in Critical and Important vulnerabilities. Of the nearly 1,400 Low and Moderate CVEs affecting our products, only two were known to be exploited.
Based on the 121 KEVs for 2023, against 23,745 CVEs (as per National Vulnerability Database) the exploitation rates are the same: only 0.51% of the 2023 CVEs in the NVD have an associated exploit. Exploitation rates against Red Hat software in 2023 will be available when the 2023 Red Hat Product Security Risk Report is published in February.
From this we can reasonably conclude that exploitation of known vulnerabilities is extremely low. It’s not to say that it doesn’t happen (it does), but the occurrences are quite limited. We can also determine, again based on our risk report, that those vulnerabilities rated Critical and Important are more likely to be exploited. In 2022, that was 10.5% and 1.1% respectively, in terms of exploitation rates. That said, if those vulnerabilities do get exploited, the impact could be much more severe. This is because Critical and Important vulnerabilities are those that lead to privilege escalation, can be exploited remotely without authentication, may not require user interaction and lead to a system compromise or denial of service. Red Hat uses an industry-standard four-point rating scale that objectively determines severity based on these characteristics.
Now we’ve looked at the exploitation rate of vulnerabilities even in the face of the constant deluge of potential vulnerabilities. It should be easy to look to trusted third-parties and research agencies for a singular score that highlights how severe a given problem might be, right? It’s…not quite that easy and something I’ll tackle in my next post.
About the author

Vincent Danen lives in Canada and is the Vice President of Product Security at Red Hat. He joined Red Hat in 2009 and has been working in the security field, specifically around Linux, operating security and vulnerability management, for over 20 years.
More like this
The nervous system gets a soul: why sovereign cloud is telco’s real second act
MCP security: The current situation
Understanding AI Security Frameworks | Compiler
Data Security And AI | Compiler
Browse by channel

Automation
The latest on IT automation for tech, teams, and environments

Artificial intelligence
Updates on the platforms that free customers to run AI workloads anywhere

Open hybrid cloud
Explore how we build a more flexible future with hybrid cloud

Security
The latest on how we reduce risks across environments and technologies

Edge computing
Updates on the platforms that simplify operations at the edge

Infrastructure
The latest on the world’s leading enterprise Linux platform

Applications
Inside our solutions to the toughest application challenges
Virtualization
The future of enterprise virtualization for your workloads on-premise or across clouds