Most electrical energy used to run computers is still generated by fossil fuels, contributing to the looming problem of climate change. This fact, along with electricity costs, means that viewing IT energy consumption and identifying consumption changes is increasingly important. Activities to save energy are increasing. For example, some companies are collaborating to cut power consumption by 40% through 2031.
The Performance Co-Pilot (PCP) suite in Red Hat Enterprise Linux (RHEL) helps with performance, debugging, and visualization. PCP includes pmda-denki (電気 or "denki" is the Japanese term for "electricity".) The pmda-denki tool enables you to measure electrical power consumption.
Energy consumption metrics are available in real time with powertop, but it doesn't do long-term measurements. With the metrics available in PCP, you have the full suite of PCP tools available for archiving metrics, visualizing them, reacting to sudden increases, and so on. Wouldn't it be interesting to compare power consumption for workloads? Many companies already do performance benchmarks on freshly committed code. Measuring the power consumption of commits can help you understand when new code is eating more resources.
What can pmda-denki do?
Current systems rarely have dedicated sensors for measuring power consumption. This article looks at the electrical consumption of computer workloads using three different data sources:
- RAPL readings: On most modern x86 systems, RAPL provides metrics relating to how much power is consumed by the CPU, RAM, and onboard GPU.
- Battery readings: For systems like laptops with a battery, you can disconnect the power plug and run the workloads from the battery. By observing how the battery discharges, you can calculate the consumption.
- Smart plug readings: Smart plugs are devices that can be inserted between a power outlet and an electrical consumer, like a computer system. The smart plug hooks into the network via WLAN or RJ-45 and reports the electrical consumption of the connected consumer.
Performance Metric Domain Agents (PMDAs) allow PCP to observe performance metrics of a certain, specialized area. For example, the pmda-postgresql can read metrics of PostgreSQL databases. You can use pmda-denki to read RAPL and battery metrics. You can also use pmda-openmetrics to make the smart plug metrics available.
These three methods have strong and weak points. RAPL is only available on the x86 architecture and does not capture the system's overall consumption. Batteries and smart plugs require certain hardware. Below are the steps to set up all three methods and then measure the power consumption for some workloads.
The test setup
The setup includes two systems:
-
The Control System, which will collect and visualize the data. It has PCP and Ansible engine installed to prepare the SUT and initiate the tests.
-
The System Under Test (SUT) whose consumption you're measuring. This test used a Thinkpad L480, chosen because it has great Linux support with all three methods available.
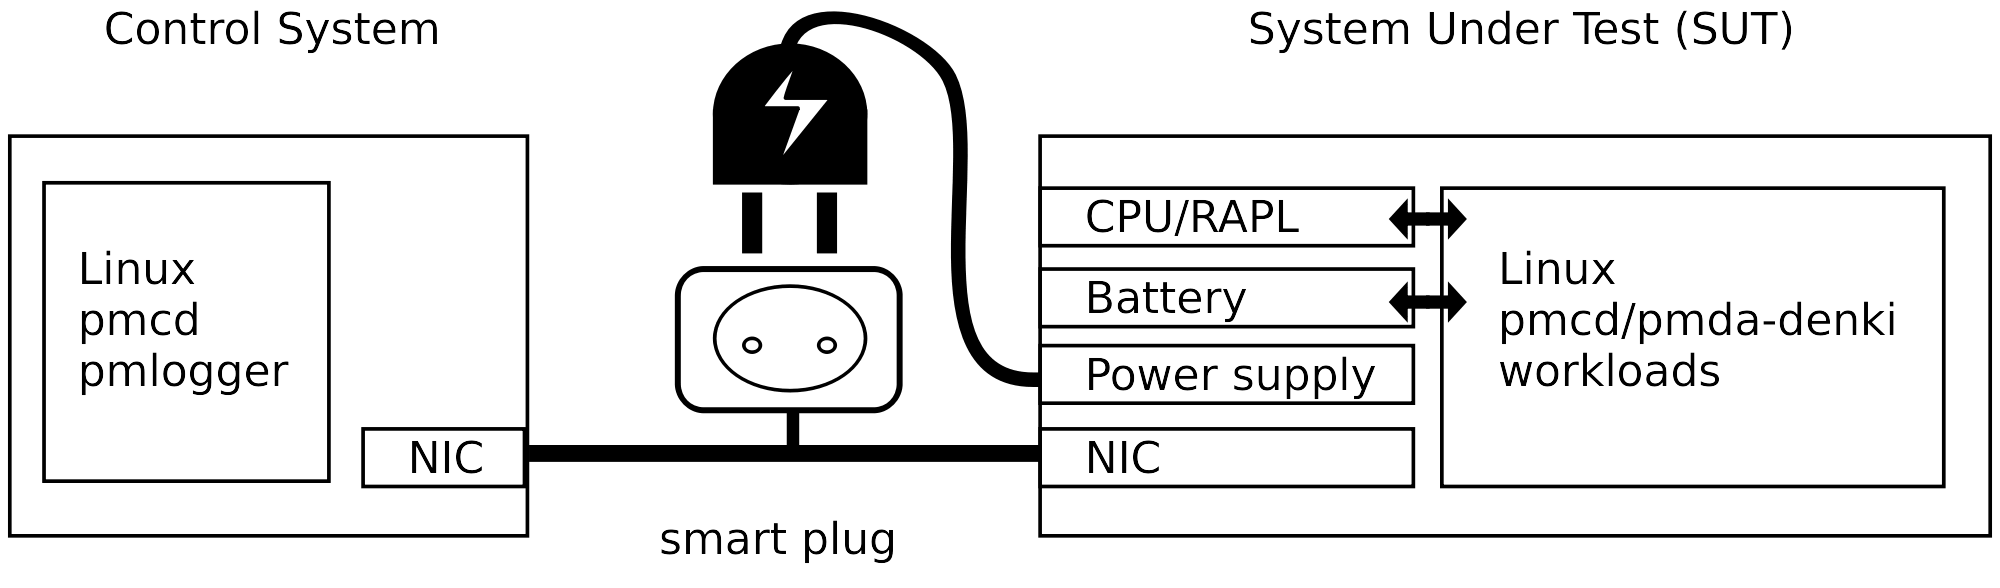
This test runs workloads for a specific amount of time and measures the energy consumption with all three methods. Afterward, you can compare the consumption measured with the various methods and compute how efficient the system was and how much energy it consumed for single jobs.
Initial configuration
The control system used Fedora 38 with PCP 6. A RHEL 8 or RHEL 9 system could be used instead.
$ sudo dnf -y install pcp-zeroconf pcp-pmda-denki
$ cd /var/lib/pcp/pmdas/denki/ && sudo ./Install
$ cd /var/lib/pcp/pmdas/openmetrics/ && sudo ./Install
The SUT ran RHEL 9. You installed pcp and pmda-denki (to make the RAPL metrics available), then configured pmcd so that the control system could read the metrics directly from the SUT.
$ sudo dnf -y install pcp pcp-pmda-denki pcp-system-tools
$ cd /var/lib/pcp/pmdas/denki/ && sudo ./Install
$ sudo echo 'PMCD_LOCAL=0' >>/etc/sysconfig/pmcd
$ sudo systemctl restart pmcd
$ sudo systemctl enable pmcd
Run this command on the control system to see the power metrics:
$ pmrep -h <IP-of-SUT> denki
Next, make the smart plug metrics available. The exact details here depend on the specific smart plug. Industry-grade plugs offer consumption metrics using an RJ-45 ethernet connector. In this article, I used a smart plug supported by the open source firmware Tasmota. The smart plug connects to the wireless network. On the control system, I deployed the file /etc/pcp/openmetrics/tasmotalive4.sh and created a symlink for the file to /var/lib/pcp/pmdas/openmetrics/config.d/tasmotalive4.sh.
I run this command to query the metric, and this in turn triggers tasmotalive4.sh:
$ pmrep openmetrics.tasmotalive4
The tasmotalive4.sh script runs this:
$ curl -s http://ip/cm?cmnd=Status%208
It extracts the power consumption from the output. The metric is handed over to openmetrics and then made available to pmrep (the command I ran).
All three kinds of metrics are available for reading from the control system. It can read them with a client like pmrep or record them into archive files for later examination.
You can now access the metrics. For example, below are the RAPL (columns labeled with 1-4) and tasmota (column 5) metrics:
$ pmrep -g denki.rapl.rate -p openmetrics.tasmotalive4.Power
[ 1] - denki.rapl.rate["package-0"] - /s
[ 2] - denki.rapl.rate["core"] - /s
[ 3] - denki.rapl.rate["uncore"] - /s
[ 4] - denki.rapl.rate["dram"] - /s
[ 5] - openmetrics.tasmotalive4.Power["0 var:out"] - none

         1       2       3       4       5
17:38:13 N/A     N/A     N/A     N/A     N/A
17:38:15 4.578   2.289   0.000   0.183    8.000
17:38:16 4.973   3.978   0.000   0.000    0.000
17:38:17 4.855   2.913   0.000   0.971   12.000
17:38:18 5.046   3.027   0.000   0.000   12.000
17:38:19 6.208   4.138   0.000   1.035   12.000
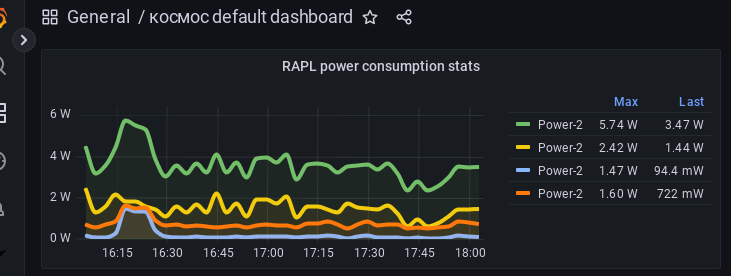
The following are the visualizations:
The test loads
With the above metrics available, you can now run workloads on the SUT and measure consumption using the three methods. I wrote a Python3 wrapper script to execute on the control system. It performs the following tasks:
- An Ansible playbook logs onto the SUT over SSH and ensures that the required packages are installed. The playbook also copies files like the actual load scripts to the SUT.
- If smart plug measurements are collected, a further Ansible playbook ensures that the control system archives the metrics into files. This allows you to review the archive files later and compute the power consumption measured by the smart plug while the load was running.
- Then the actual workloads start. The first load executes
sleepon the SUT by default. This provides the system's idle consumption, which should be as low as possible to properly measure the load caused by the compute jobs later. - Next, a script puts all CPU cores of the SUT under load. It does not measure any results but evaluates the maximum consumption.
- A script extracts a
tar.xzfile in a loop, removes the extracted files, and starts again. This is done in memory to keep the impact of storage devices down. This example extracts the sources of the Apache web server. - Finally, a script loops for at least 300 seconds. It creates a copy of the Apache sources, runs 'configure', and compiles Apache.
Compute the average consumption while each of these jobs was running. For example, compute how much energy was consumed for a single Apache compilation.
Of course, these scripts are examples. You will want to run your own workloads and measure the consumption. For example, you can run load tests against two versions of a software you wrote and compare their consumption.
Measure consumption for the jobs
The following is an example output from running the compile job:
### Running  job_httpd_compile.sh  for at least  300 sec..
    executing:  ssh -x chris@dennou "cd /dev/shm; ./job_httpd_compile.sh 300"
    Workload did run 8 times, a single job did run 37.5 sec.
    ### RAPL
       Average power consumption:            11.46 W
       Single job run, power consumption:     0.11934 Wh
    ### Battery
       Average power consumption:            16.68 W
       Single job run, power consumption:     0.17375 Wh
The results for measured power consumption:
|
Job name |
RAPL cons. |
Battery cons. |
Tasmota cons. |
|
sleep |
0.2W |
1.4W |
2.7W |
|
just-load |
18.4W |
23.6W |
28.2W |
|
httpd-src-extract |
11.5W |
15.7W |
18.2W |
|
httpd-compile |
11.5W |
16.7W |
17.6W |
The first job sleeps the system for five minutes. Executed on the Thinkpad L480, we get a report from RAPL that, on average, 0.2W was consumed in these five minutes. The battery measurement reports 1.4W, and the smart plug reports 2.7W. This pattern occurs with the other loads: RAPL only covers CPU/memory/GPU and reports the lowest metrics. The battery measurement covers the motherboard, USB devices, and so on. Its consumption is higher. The smart plug reports even higher values.
For the just-load job, four instances of md5sum /dev/urandom are started. RAPL is at 18.4W. The fan is also spinning up with this load. That additional consumption is covered by battery and Tasmota metrics.
For the other two jobs, the consumption goes down. These are not perfectly parallelized; not all cores are under constant load.
An important takeaway is that while the various methods report different values, all of them are good for comparing workloads. If you have two versions of a software, all of these methods can help to compare the consumption.
The script for execution on the control system (which runs the jobs on the SUT) and the Ansible scripts for preparation are available from my Git repository. The directory denki-jobrunner contains the job scripts and openmetrics has the script fetching metrics from the Tasmota smart plug.
You are welcome to use these, but they are provided for convenience. They are not supported by Red Hat.
Power metrics
You have seen how to make power consumption metrics available and how to compare power consumption for various workloads. When available, pmda-denki's battery-based metrics help to calculate the overall system consumption. RAPL just covers some subsystems but is available on almost all servers. With PCP, pmda-denki, and pmie, one could also implement monitoring that sends alerts if power consumption suddenly rises.
Many new opportunities can be unlocked now, such as constantly monitoring the energy consumption of RHEL systems to notice sudden increases.
KDE has started the eco project around sustainability and there are more presentations like Free software is sustainable software. Tools like pmda-denki can help compare the power consumption of workloads and notice when new commits increase power use.
- Blog article to install PCP/Grafana, showing how to visualize pmda-denki metrics.
- Setting up PCP with the product documentation. This stays updated as new RHEL versions are released.
- Interactive lab for setting up PCP/Grafana.
- The pmda-denki handbook has further details on installation and use cases.
About the author

Christian Horn is a Senior Technical Account Manager at Red Hat. After working with customers and partners since 2011 at Red Hat Germany, he moved to Japan, focusing on mission critical environments. Virtualization, debugging, performance monitoring and tuning are among the returning topics of his daily work. He also enjoys diving into new technical topics, and sharing the findings via documentation, presentations or articles.
More like this
More than meets the eye: Behind the scenes of Red Hat Enterprise Linux 10 (Part 6)
More than meets the eye: Behind the scenes of Red Hat Enterprise Linux 10 (Part 5)
OS Wars_part 1 | Command Line Heroes
OS Wars_part 2: Rise of Linux | Command Line Heroes
Browse by channel

Automation
The latest on IT automation for tech, teams, and environments

Artificial intelligence
Updates on the platforms that free customers to run AI workloads anywhere

Open hybrid cloud
Explore how we build a more flexible future with hybrid cloud

Security
The latest on how we reduce risks across environments and technologies

Edge computing
Updates on the platforms that simplify operations at the edge

Infrastructure
The latest on the world’s leading enterprise Linux platform

Applications
Inside our solutions to the toughest application challenges
Virtualization
The future of enterprise virtualization for your workloads on-premise or across clouds