Picking up from where we left off in the last post, the purpose of this post will be to show how we can use Performance Co-Pilot (PCP) and bpftrace together to graph low-level kernel metrics that are not typically exposed through the usual Linux tools. Effectively, if you can get a value from the kernel into an eBPF map (generic key/value data structure used for storing data in eBPF programs) in a bpftrace script, then you can get this graphed with Performance Co-Pilot.
To start, let’s look at how we can set up a development environment to work with bpftrace and Performance Co-Pilot. Once you have followed the steps in the last two posts, you have Performance Co-Pilot and Grafana installed and working. We’re now going to go to server-1 and install pcp-pmda-bpftrace:
yum install bpftrace pcp-pmda-bpftrace -y
cd /var/lib/pcp/pmdas/bpftrace
./Install
To test that we have properly installed the bpftrace pmda, let’s try:
pmrep bpftrace.scripts.runqlat.data_bytes -s 5
and we should see 5 samples of run queue latency measured in microseconds:
  b.s.r.data_bytes
            byte/s
               N/A
           586.165
           590.276
           588.141
           589.113
Now that we have the bpftrace pmda working with Performance Co-Pilot, we can begin the work of integrating this with Grafana in our development environment. We are starting with the development environment as you will want to refine your bpftrace script before moving it to production.
Further, enabling pcp bpftrace in Grafana requires creating a ‘metrics’ user for Grafana that can run any valid bpftrace script as root! You would want to steer away from doing this in production. Further in this post, we’ll cover how to use bpftrace scripts with pcp and Grafana in production.
So let’s grant that access by creating a ‘metrics’ Performance Co-Pilot user:
yum install cyrus-sasl-scram cyrus-sasl-lib -y
useradd -r metrics
passwd metrics
saslpasswd2 -a pmcd metrics
chown root:pcp /etc/pcp/passwd.db
chmod 640 /etc/pcp/passwd.db
The saslpasswd2 command sets the password we’ll use and adds the ‘metrics’ user to the pmcd sasl group, allowing it access to pcp data.
You’ll want to make sure these two lines are set in /etc/sasl2/pmcd.conf as well:
mech_list: scram-sha-256
sasldb_path: /etc/pcp/passwd.db
Now that we’ve done this, we do need to restart pcp, so we'll use systemctl:
systemctl restart pmcd
Now, we need to configure the bpftrace pmda to allow this new user to use it. Please bear in mind that this step is intended for development purposes and not production. To do that we need to edit /var/lib/pcp/pmdas/bpftrace/bpftrace.conf and make sure these two items are set under [dynamic_scripts]:
enabled=true
allowed_users=root,metrics
Once these changes have been made, we need to re-install the bpftrace pmda:
cd /var/lib/pcp/pmdas/bpftrace
./Remove
./Install
Now we are ready to browse to grafana at http://server-1:3000 and login with the admin password that we set in the first blog.
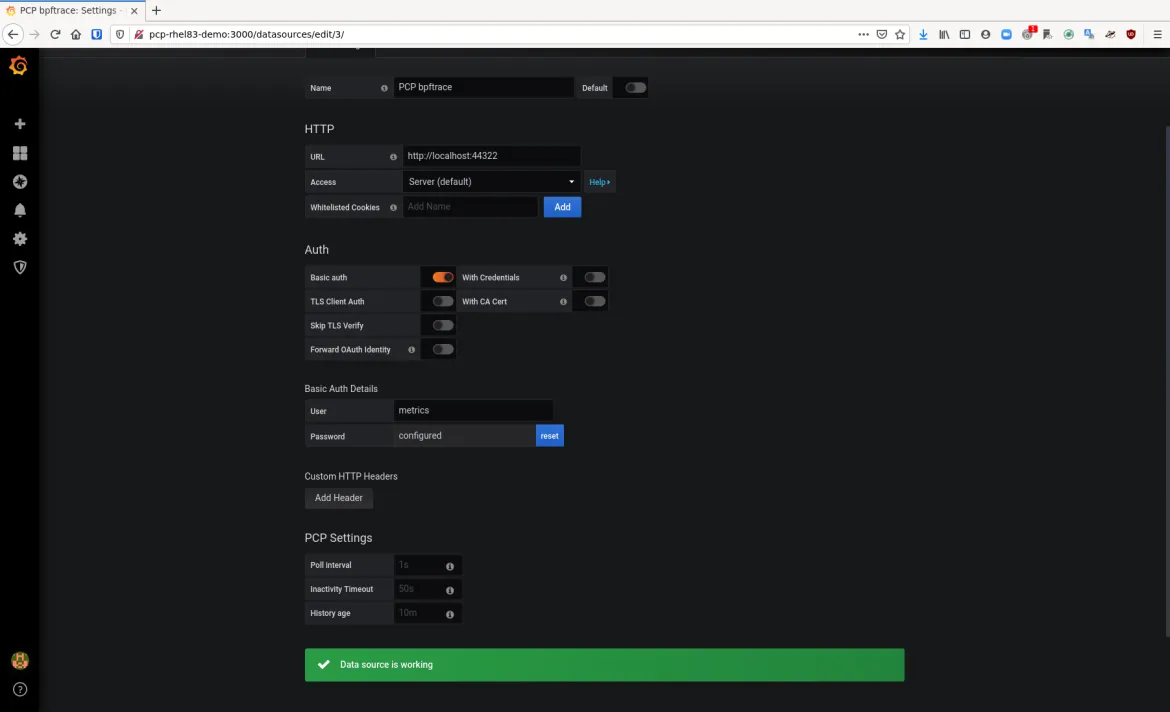
Click the “Configuration” cog and then “Data Sources”. Now click “Add Data Source” and scroll to the bottom of the page where “PCP bpftrace” is, hover over it and click “Select”.
For the URL field on the form, enter “http://localhost:44322” and under “Auth” click “Basic auth”. A “Basic Auth Details” section will appear and you will enter the username of “metrics” and the password that you set with saslpasswd2 in the previous step. When you have done this, click “Save & Test” and you should get the message “Data source is working”.
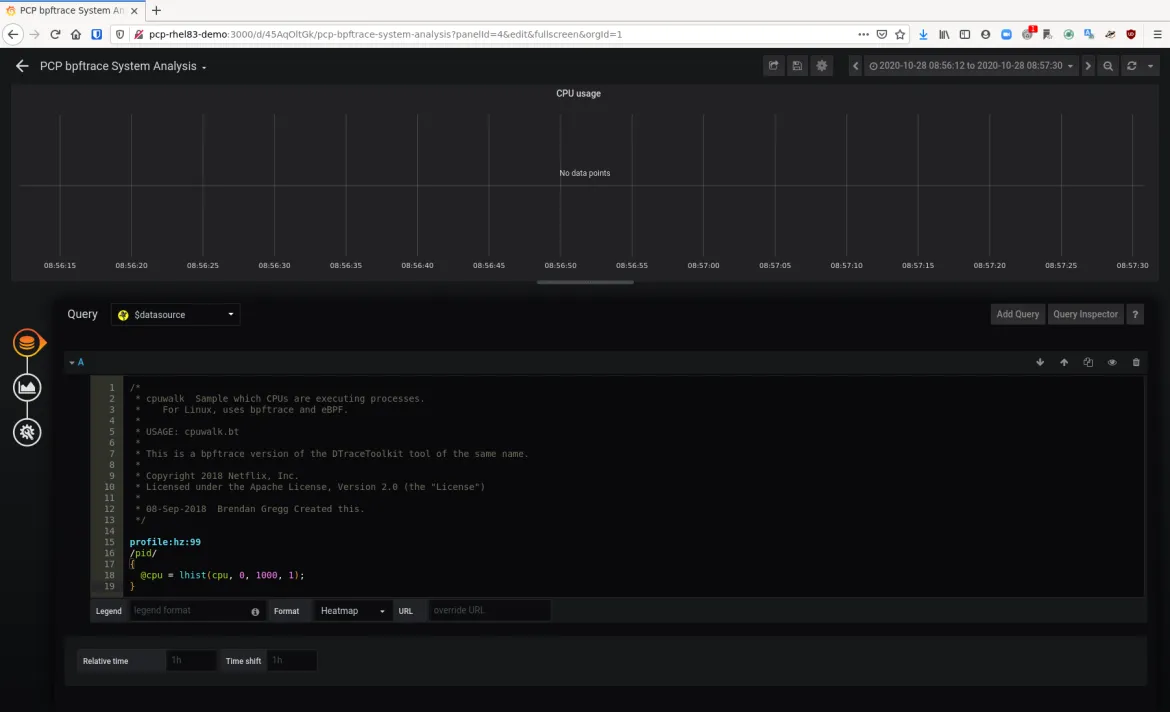
Now click on the Dashboards Icon and select “Manage”. In this list, you will see a dashboard named “PCP bpftrace System Analysis”. Click on that one. You will see a number of metrics here. Click the drop down next to “CPU usage” and click “Edit”. Once this is up, you’ll see that the query is an actual bpftrace script and in this case, it populates a bpf map called “@cpu” that gets populated with a histogram of CPU data which represents CPU usage. Grafana takes this bpf map and graphs it.
Let’s take a look at how we can use bpftrace scripts to graph kernel data, such as the number of pids per second as presented via fork. Brendan Gregg has written pidpersec.bt to do just that and the key piece of that script that we need is this:
tracepoint:sched:sched_process_fork
{
     @ = count();
}
This will basically count the number of times that sched_process_fork is called and store it in a bpf map that we can then graph with grafana.
So let’s get started on building a panel that will graph it! Back on the main “PCP bpftrace System Analysis” dashboard page, there is an “Add Panel” button. Click that and then you will see a new panel with two buttons. Click the “Add Query” button.
Next to the word “Query” there will be a drop down. Select this drop down and pick “PCP bpftrace”. Now in the text box for Query A, put the bpftrace script in:
tracepoint:sched:sched_process_fork
{
     @ = count();
}
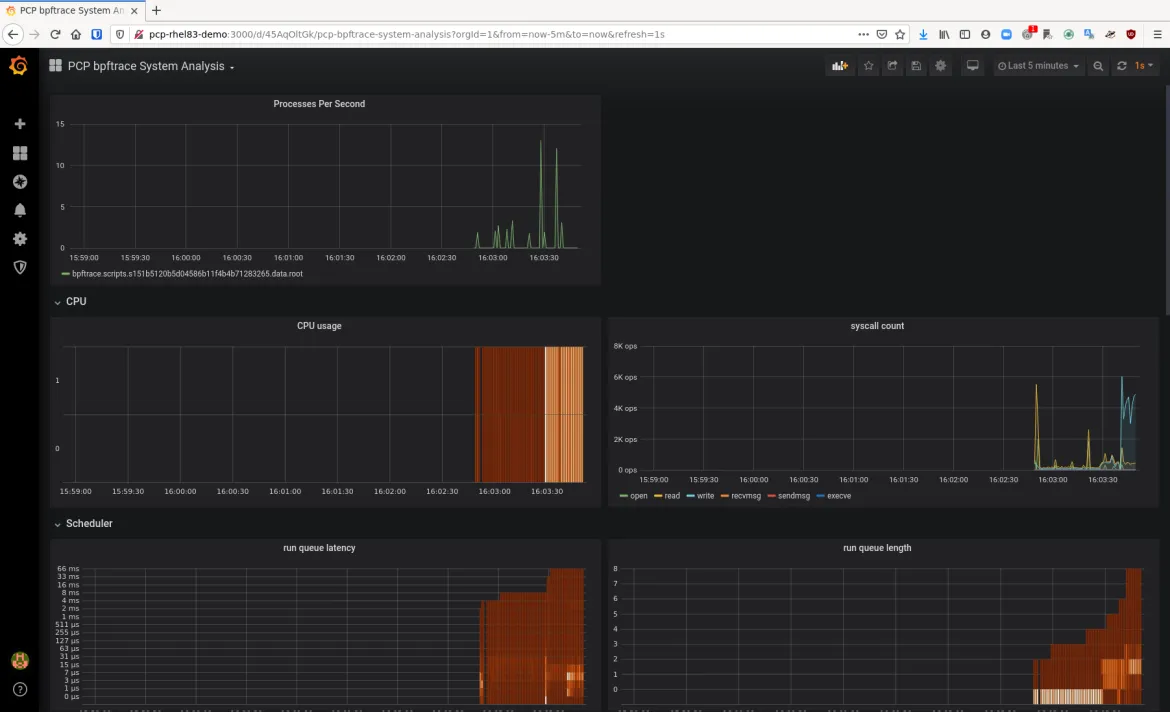
Now you can click on the “General” configuration button and set the title to be “Processes Per Second”. Now you can go back to the main “PCP bpftrace System Analysis” board and see that this metric is graphed on your dashboard. You could save this dashboard if you like.
While that’s really cool, remember that you had to give this particular grafana user access to the metrics pcp user who can now run any bpftrace script on this system! That’s fine in development, but we don’t want to do this in production. We need a way to expose our new processes per second bpftrace script to production users without letting them run whatever bpftrace script they want.
The bpftrace pmda package provides us with this capability. The bpftrace scripts stored in /var/lib/pcp/pmdas/bpftrace/autostart are loaded as regular Performance Co-Pilot metrics when the bpftrace pmda is loaded.
So, let’s edit /var/lib/pcp/pmdas/bpftrace/autostart/pidpersec.bt and have it read:
tracepoint:sched:sched_process_fork
{
     @ = count();
}
Once this has been saved, do:
cd /var/lib/pcp/pmdas/bpftrace/
./Remove
./Install
pminfo | grep pidpersec
and you should see output similar to:
bpftrace.scripts.pidpersec.data.root
bpftrace.scripts.pidpersec.data_bytes
bpftrace.scripts.pidpersec.code
bpftrace.scripts.pidpersec.probes
bpftrace.scripts.pidpersec.error
bpftrace.scripts.pidpersec.exit_code
bpftrace.scripts.pidpersec.pid
bpftrace.scripts.pidpersec.status
Because we did not name our bpf map, the pmda names our map “root.” This is the value we want to see and we can now query it with:
pmrep bpftrace.scripts.pidpersec.data.root -s 5
and get output similar to:
  b.s.p.d.root
            /s
           N/A
         3.984
        31.049
         0.000
         0.000
Showing the number of processes forked per second. We can take this metric into grafana and graph it without giving the grafana user special privileges as this is now a standard Performance Co-Pilot metric.
Back in Grafana, click on the Dashboards icon and click “Manage”. Then, click “PCP Vector Host Overview”. Then click the “Add Panel” button and then in the new panel, click “Add Query”.
Next to the word “Query” there will be a drop down menu. Pick “PCP Vector” from this menu and in the “A” query, simply put:
bpftrace.scripts.pidpersec.data.root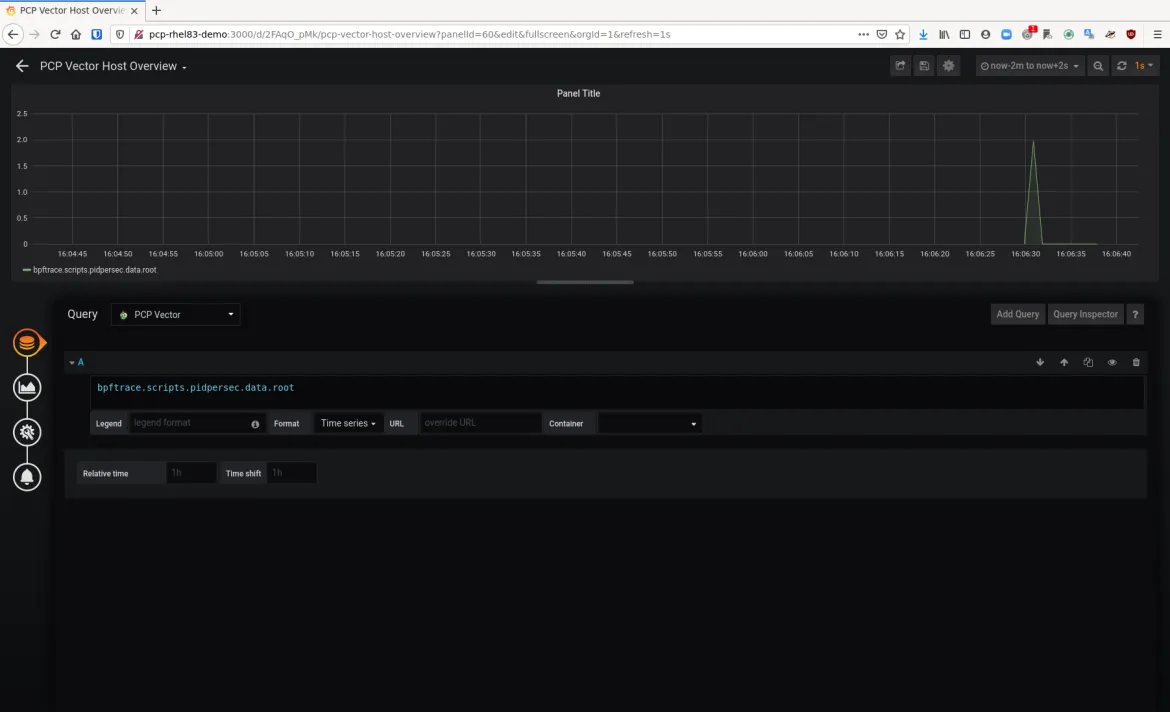
Now click the “General” icon and set the title to “Processes per Second”.
Once back on the “PCP Vector Host Overview” dashboard, you’ll see our bpftrace script’s bpf map graphed by a regular user without special permissions. This is now safe for production usage.
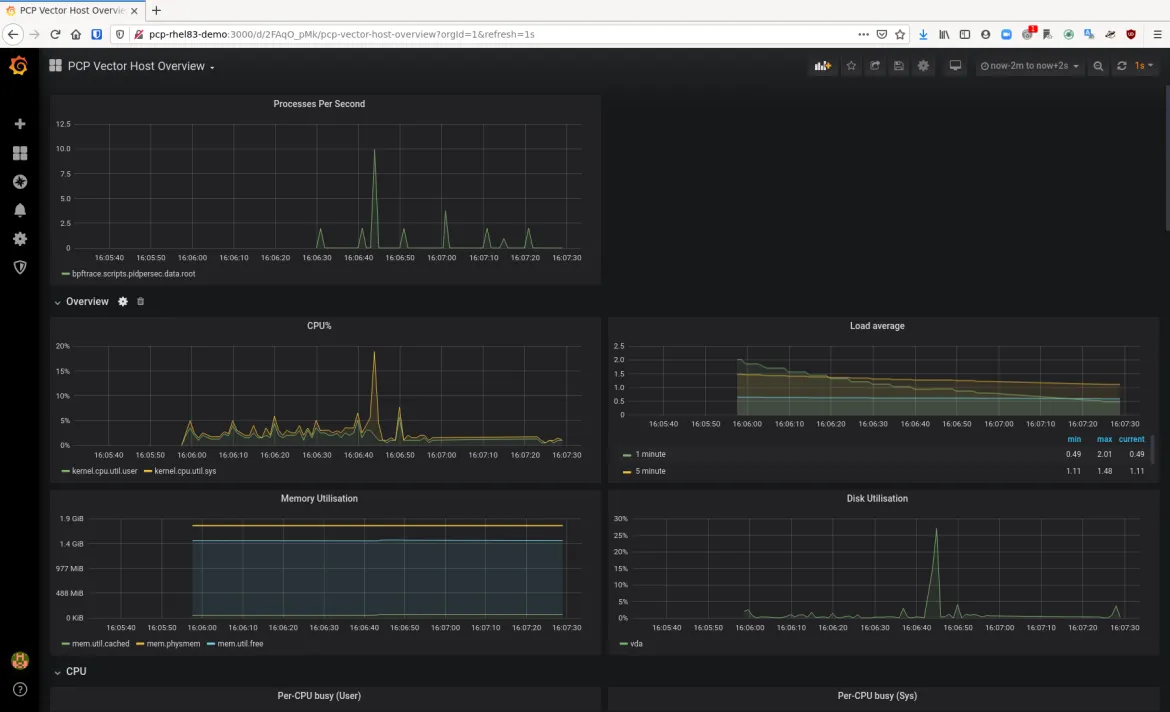
And that’s how you can use pcp-pmda-bpftrace to expose kernel metrics to graphs in Grafana!
You should note that using a bpftrace script in this manner means that it will be constantly running. As such, you will want to make sure you are comfortable with the overhead your script requires. Bpftrace scripts are generally low overhead additions to a system, but it is possible to create scripts that gather a lot of data and incur higher overhead.
This concludes this series of posts on how to visualize system performance with Red Hat Enterprise Linux (RHEL) 8. As you can see, RHEL 8 provides modern, capable tooling to visualize system performance graphically.
Previous Posts
About the author
Karl Abbott is a Senior Product Manager for Red Hat Enterprise Linux focused on the kernel and performance. Abbott has been at Red Hat for more than 15 years, previously working with customers in the financial services industry as a Technical Account Manager.
Browse by channel
Automation
The latest on IT automation for tech, teams, and environments
Artificial intelligence
Updates on the platforms that free customers to run AI workloads anywhere
Open hybrid cloud
Explore how we build a more flexible future with hybrid cloud
Security
The latest on how we reduce risks across environments and technologies
Edge computing
Updates on the platforms that simplify operations at the edge
Infrastructure
The latest on the world’s leading enterprise Linux platform
Applications
Inside our solutions to the toughest application challenges
Original shows
Entertaining stories from the makers and leaders in enterprise tech
Products
- Red Hat Enterprise Linux
- Red Hat OpenShift
- Red Hat Ansible Automation Platform
- Cloud services
- See all products
Tools
- Training and certification
- My account
- Customer support
- Developer resources
- Find a partner
- Red Hat Ecosystem Catalog
- Red Hat value calculator
- Documentation
Try, buy, & sell
Communicate
About Red Hat
We’re the world’s leading provider of enterprise open source solutions—including Linux, cloud, container, and Kubernetes. We deliver hardened solutions that make it easier for enterprises to work across platforms and environments, from the core datacenter to the network edge.
Select a language
Red Hat legal and privacy links
- About Red Hat
- Jobs
- Events
- Locations
- Contact Red Hat
- Red Hat Blog
- Diversity, equity, and inclusion
- Cool Stuff Store
- Red Hat Summit

