
Red Hat OpenShift AI is an artificial intelligence (AI) platform portfolio that provides tools to train, tune, serve, monitor and manage AI and machine learning (ML) experiments and models on Red Hat OpenShift. OpenShift AI builds on the proven capabilities of OpenShift to provide a single, consistent, enterprise-ready hybrid AI and MLOps platform.
The model serving stack included in OpenShift AI is generally available (GA) as of December 2023 (release 2.5), meaning that OpenShift AI is fully operational to deploy and serve inference models via the KServe API. You may have read my colleague David Gray's article about the performance of this model serving stack for large language models (LLMs). This article provides a different look at that same model serving stack. It discusses how we stress tested the model deployment and model serving controllers to confirm that they perform and scale well in single-model, multi-model and many-model environments.
The following sections present the results of three different flavors of performance and scale testing. Each flavor focuses on a particular aspect of the product:
- Single-model performance testing: Focuses on the performance of the model and its serving runtime to verify that it does not regress over the releases.
- Multi-model performance and scale testing: Focuses on the performance of the model serving stack when running under heavy load but at low scale.
- Many-model scale testing: Focuses on the scalability of the model deployment stack when running at large scale.
These tests ran on an NVIDIA DGX-A100 system tailored for AI computing with eight A100-40GB GPUs, 256 CPU cores and 1TB of main memory.
The performance and scale testing was performed in a transparent and reproducible manner under the control of continuous integration (CI) automation. There was no human interaction involved in the test execution and generation of the visualization charts. These tests will be used in our continuous performance testing environment as a baseline for confirming that future releases of OpenShift AI do not degrade the model serving performance.
Single-model performance evaluation
The first test scenario focuses on capturing the performance of a model and the model serving runtime. This is the base of our continuous performance testing, where we want to ensure that various key performance metrics will not regress over time.
The load test consists of a wrapper of the GHZ benchmark tool, which runs multiple ghz instances concurrently. The test configuration is the following:
- The model under test runs alone in the cluster with no other model instantiated
- 32 queries randomly picked up from a subset of the Hugging Face OpenOrca dataset
- 16 ghz workers running in parallel
- Duration of 10 minutes
- The model runs on one NVIDIA A100-40GB GPU
Here is an illustration of one test execution. We see the model’s latency per token (also called Time Per Output Token (TPOT)). We see that smaller models, like the flan-t5 small and large, answer much faster than bigger models. Also, for a given model, the latency per token can vary significantly depending on the number of tokens requested.
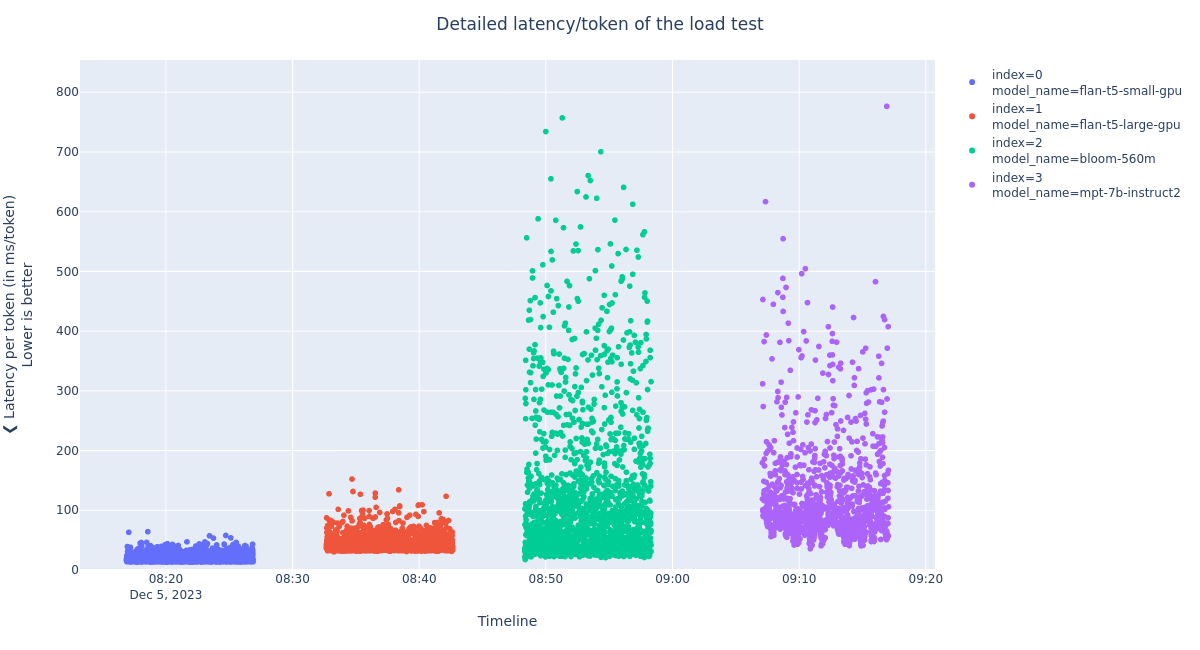
Details of the latency per token of the load test answers
An in-depth analysis of the model performance was outside the scope of this work. See our other recently published post, Evaluating LLM Inference Performance on Red Hat OpenShift AI, to better understand how we evaluate the performance of the llama-2 model in terms of latency, throughput, and cost on AWS instances.
From these single-model benchmarks, we extract various performance indicators that will be compared from release to release, to ensure that they do not regress. The plots below show an illustration of the model’s latency per token distribution, the throughput (number of token per second over the test duration) and average latency.
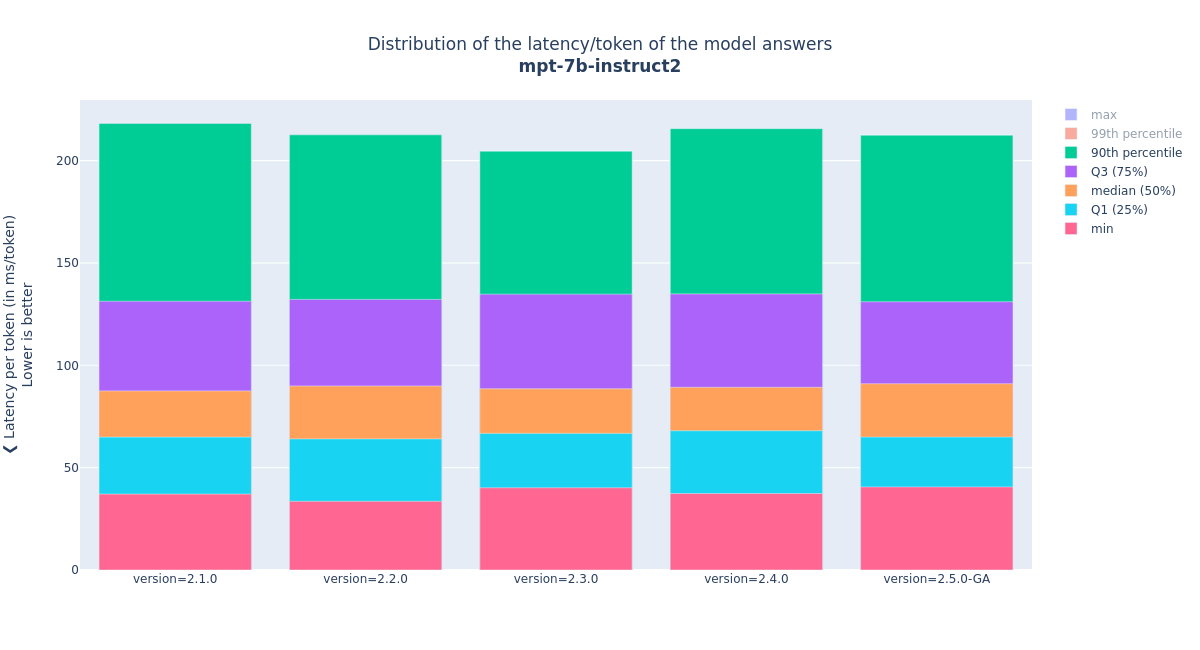
Distribution of the latency per token of the mpt-7b-instruct2 model with 16 virtual users, against the last five releases of OpenShift AI/KServe
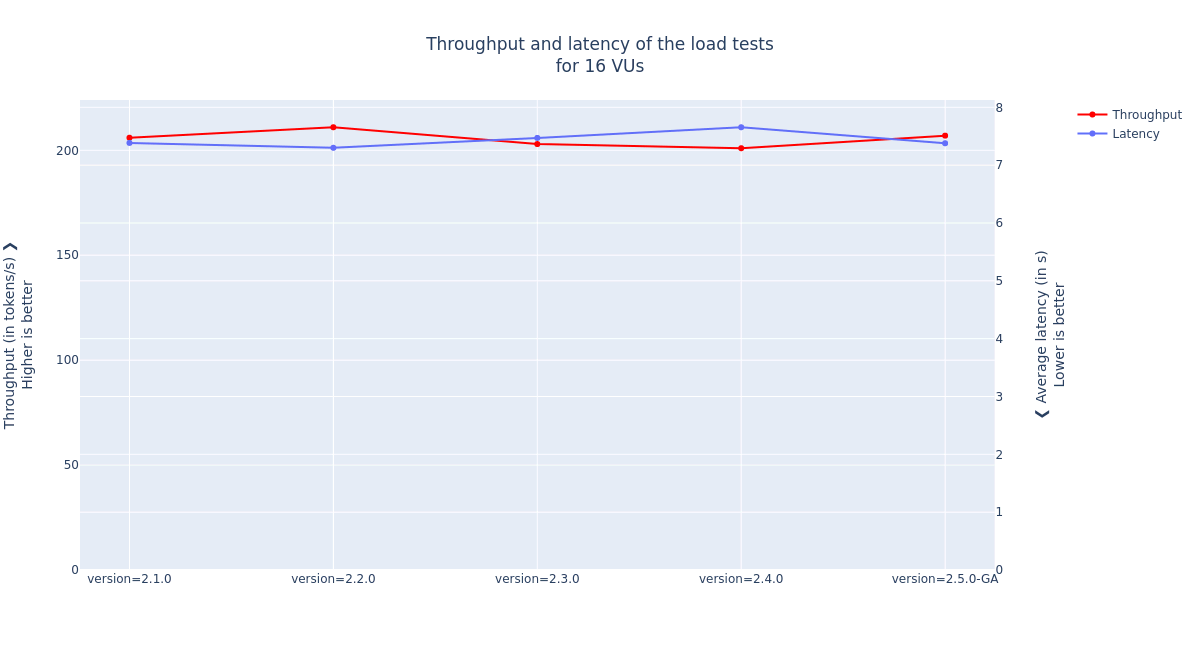
Throughput and average latency of the mpt-7b-instruct2 model with 16 virtual users, against the last five releases of OpenShift AI/KServe
The data points of the last version, 2.5.0-GA, will be used as reference for the regression analyses of the upcoming versions. The minor fluctuations before the GA version are expected. They come from the stabilization of the model serving stack. From now on, the OpenShift AI quality engineering (QE) team will track performance improvements and degradation as we enhance our model serving capabilities.
Multi-model performance and scale testing
Our second test involves a larger-scale scenario. In it, we deploy one model per GPU on each of the eight GPUs of the NVIDIA DGX-A100. We perform a concurrent load test against all models simultaneously. This mimics a production inference service deployment with users querying the different models deployed on it.
Once this concurrent test is completed, we perform a sequential round of load testing on all of the models. This second round of tests provides a base-line for measuring any performance degradation that may appear during the concurrent testing.
We deployed two instances of each of these four models for this multi-model test:
- flan-t5-small-gpu
- flan-t5-large-gpu
- bloom-560m
- mpt-7b-instruct2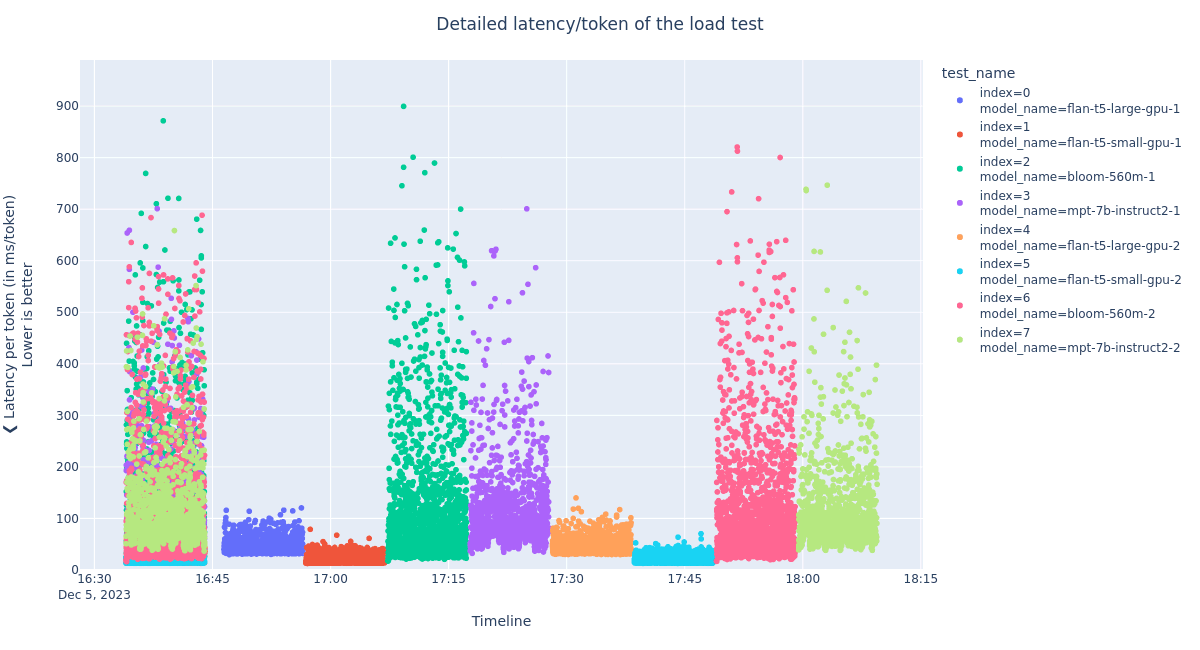
The plot above gives a visual overview of the test scenario:
- Each color corresponds to a distinct model instance
- All eight models are queried concurrently during the first ten minutes (from 16:35 to 16:45)
- The points overlap, showing that all the models are queried simultaneously
- All eight models are queried sequentially after 16:45
- Each period of 10 minutes has a single color, showing that only model is being queried
Consider the two instances of the mpt-7b-instruct2 model (indexes 3 and 7 / colors purple and light green):
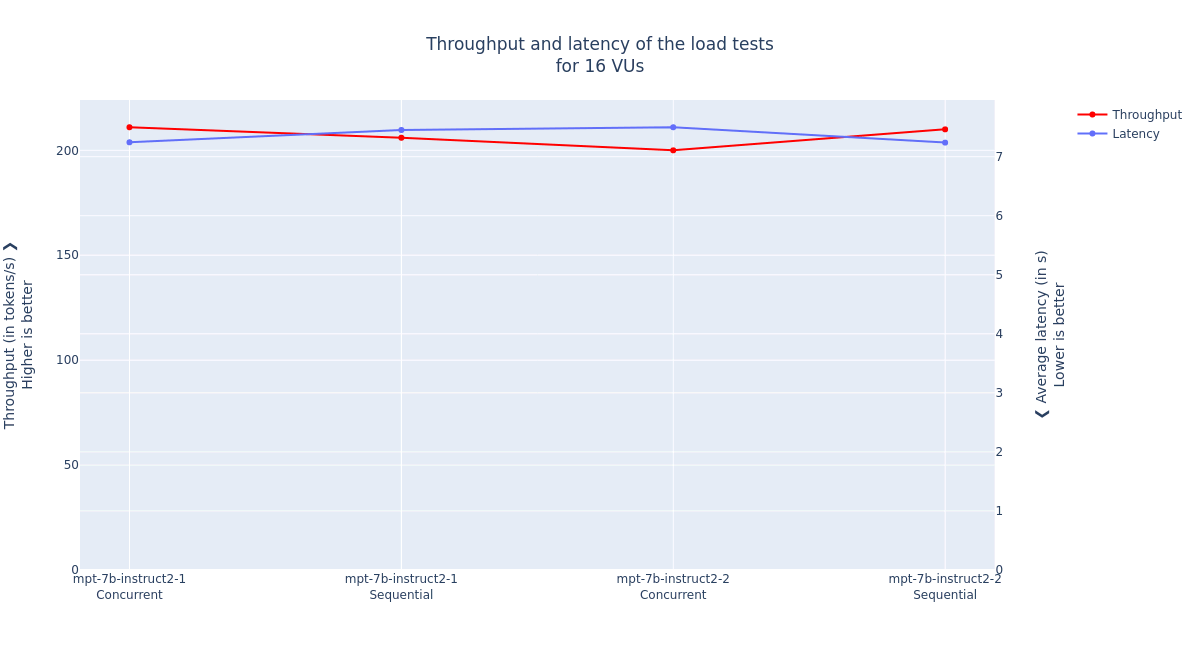
Throughput and average latency of the mpt-7b-instruct2 model with 16 virtual users, during the concurrent and sequential testing
The performance of the concurrent and sequential tests is very similar, which was the expected result. This means that at this level of concurrency, OpenShift AI data plane is not saturated, and it is able to serve all the requests in due time.
After looking at the performance of single- and multi-model deployments, let us continue with the many-model scale test, where we study how OpenShift AI behaves when a large number of models are deployed simultaneously.
Many-model scale testing
Many-model scale testing aims to verify that all the controllers involved in the model serving stack can deploy many models concurrently. This test stretched the NVIDIA DGX-A100 system to deploy 204 models. We had to tune three settings to reach this goal:
- Increase the maximum number of pods per node: OpenShift nodes are configured by default to run only 250 pods per node. However, large servers, such as the NVIDIA DGX-A100, can support more pods than that. See this guide for the procedure to increase the number of pods allowed.
- Tune the ServiceMesh control plane: The default
ServiceMeshControlPlanesettings are tuned for general purpose use cases where resources may be constrained. The configuration below optimizes theServiceMeshControlPlaneso that it can efficiently support a large number of models. ThePILOT_FILTER_GATEWAY_CLUSTER_CONFIG: "true" flag setting significantly reduces the memory Istio consumption, as the cluster configuration is now sent to a reduced set of endpoints.
cat <<EOF > smcp-patch.yaml
apiVersion: maistra.io/v2
kind: ServiceMeshControlPlane
metadata:
 name: data-science-smcp
 namespace: istio-system
spec:
 gateways:
   egress:
     runtime:
       container:
         resources:
           limits:
             cpu: 1024m
             memory: 4G
           requests:
             cpu: 128m
             memory: 1G
   ingress:
     runtime:
       container:
         resources:
           limits:
             cpu: 1024m
             memory: 4G
           requests:
             cpu: 128m
             memory: 1G
 runtime:
   components:
     pilot:
       container:
         env:
           PILOT_FILTER_GATEWAY_CLUSTER_CONFIG: "true"
         resources:
           limits:
             cpu: 1024m
             memory: 4G
           requests:
             cpu: 128m
             memory: 1024Mi
EOF
kubectl patch smcp/data-science-smcp -n istio-system --type=merge --patch-file smcp-patch.yaml- Limit sidecar-proxy endpoints to their own namespace and istio-system: ServiceMesh proxies can communicate with any namespace participating in the mesh by default. The optimization below reduces the scope of the mandatory namespaces, greatly lowering the CPU and memory consumption of the different ServiceMesh pods and containers. This resource must be created in all namespaces where
InferenceServiceswill be deployed.
apiVersion: networking.istio.io/v1beta1
kind: Sidecar
metadata:
 name: default
 namespace: $namespace
spec:
 egress:
 - hosts:
   - "./*"
   - "istio-system/*"
We also had to use a small model (flan-t5-small) and reduce its CPU and memory requirements as much as possible. In this many-model configuration, we chose not to perform any load test on the models (they would not behave properly because of the hardware constraints). We conducted 20 GRPC calls and ensured they did not fail to validate their functionality.
The deployment/validation scenario is as follows:
for each of the 12 namespaces:
 for each of the 17 model instances:
    deploy the model instance
    validate the model instance with 10 queries
  validate each of the the 17 model instances  with 10 queries
We reached the target of 204 with these procedures and settings. InferenceServices loaded in the NVIDIA DGX-A100.
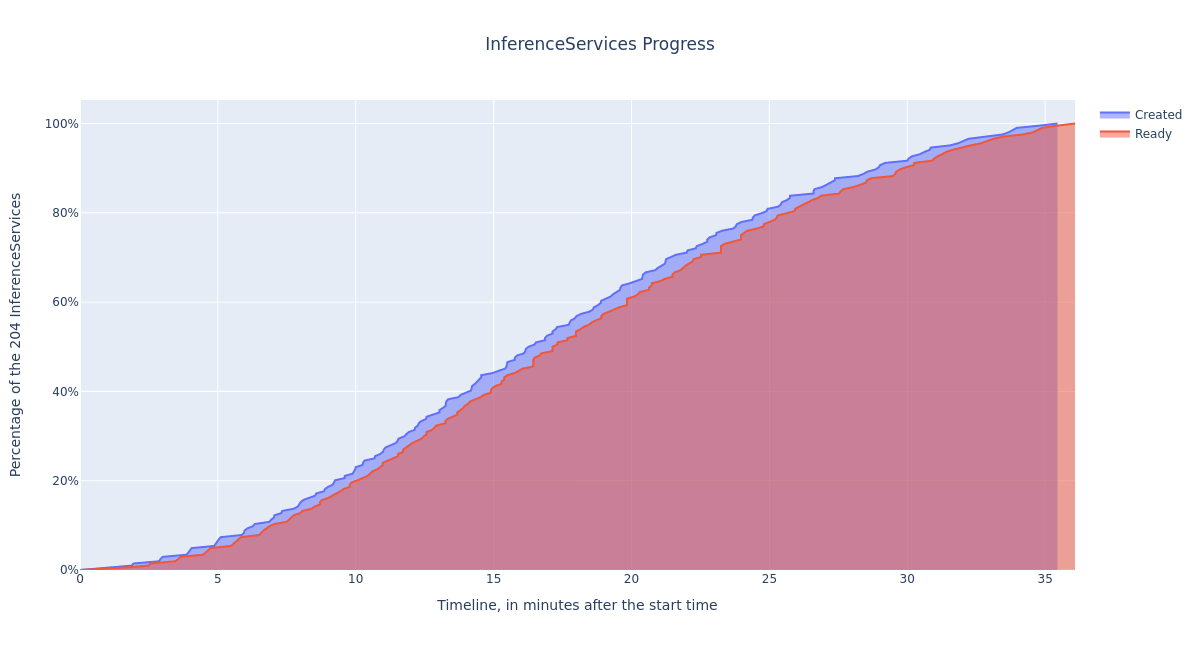
Progress of the InferenceService creation and readiness over the test duration
This plot shows the number of InferenceServices created (blue) and the number of InferenceServices ready to operate (red). We can see that overall, the curves are smooth and have the same shape. This testifies that the controllers in charge of InferenceServices the reconciliation are not saturated. They keep a fairly constant pace, as the distribution plot below shows.
In the first five to seven minutes of the test, we can observe minor crank patterns. If the system were to be saturated, such patterns would emerge at greater scales in the two lines.
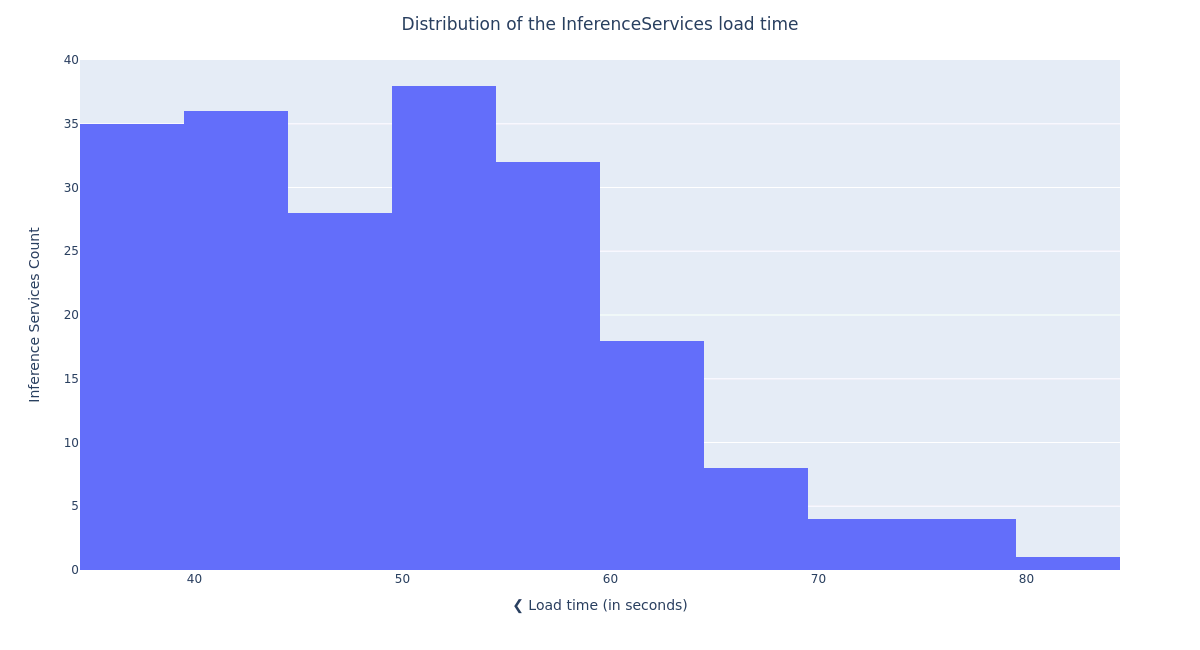
Distribution of the InferenceService load times
0% of the InferenceServices were ready in less than 36 seconds [min]
25% of the InferenceServices were ready in less than 42 seconds [Q1]
50% of the InferenceServices were ready in less than 50 seconds (+ 8 seconds) [median]
75% of the InferenceServices were ready in less than 57 seconds (+ 7 seconds) [Q3]
90% of the InferenceServices were ready in less than 63 seconds (+ 6 seconds) [90th quantile]
100% of the InferenceServices were ready in less than 83 seconds (+ 20 seconds) [max]
The plot above shows that the distribution of the delay between the creation and readiness of each model remains low, for the deployment of all of the 204 models. This is the key result of this test. We see that there is a factor of 2.3 between the fastest model load (36s) and the slowest (83s), and 90% of the models were loaded in less than 63s. This confirms that the load time dispersion is low, so even when a large number of models are being deployed in the system, OpenShift AI users will not have to wait an unexpectedly long time before their model gets ready.
Future work
This article presented three different flavors of the performance and scale testing we executed to validate the behavior of the GA version of the KServe component of Red Hat OpenShift AI 2.5:
- Single-model performance testing, which will be used for automated regression analyses.
- Multi-model performance and scale testing, which showed the model-serving stack can handle a large number of concurrent users without performance degradation.
- Many-model scale testing, which highlighted that the stack can seamlessly handle the deployment of more than 200 models within 35 minutes.
We're committed to integrating these tests into a continuous performance testing environment as part of our upcoming work so that the release of a new OpenShift AI version can be gated by performance regression analysis. This will also enable us to track and report performance improvements over time.
We also plan on extending the automation to perform a more in-depth analysis similar to what we carried out for the llama-2 model (see the Evaluating LLM Inference Performance on Red Hat OpenShift AI blog post).
关于作者


产品
工具
试用购买与出售
沟通
关于红帽
我们是世界领先的企业开源解决方案供应商,提供包括 Linux、云、容器和 Kubernetes。我们致力于提供经过安全强化的解决方案,从核心数据中心到网络边缘,让企业能够更轻松地跨平台和环境运营。