
OpenShift ships with a pre-installed monitoring stack for monitoring platform components out of the box. The monitoring stack is based on the Prometheus open source project and includes multiple components such as Grafana for analyzing and visualizing metrics. Developers and other users often need to monitor services and pods in their projects and namespaces. These users may be interested in observing application level metrics exposed by their services or other platform metrics such as CPU usage, memory usage, requests rate and timeouts within specific namespaces. Such requirements can be fulfilled when monitoring for user-defined projects is enabled by a cluster administrator.
We can further create alerting rules, trigger alerts when a metric reaches a set threshold and manage alerts within the Alerting UI in OpenShift. For example, we might want to trigger an alert when requests to a service times out after a specified number of consecutive requests within a time-period. This can be achieved with alerting rules. Alerting rules are defined in a YAML file and contains a PromQL expression of the alert condition.
Alert rules and their states can be viewed within the OpenShift Alerting UI, however application and platform teams might also have requirements to receive notifications on external systems when an alert is in firing state. OpenShift currently supports routing alert notifications to four external receiver types: Email, Slack, PagerDuty and Webhook. With OpenShift 4.10, there is one supported way of routing alerts to external systems: A cluster administrator configures the receiver from within Alertmanager UI or applies a YAML configuration. In the next sections, we will:
- Describe the steps for enabling user-defined project monitoring so we can monitor services within a specific namespace.
- Deploy a sample service within a specific namespace and create an Alerting rule.
- Configure Slack to post OpenShift alerts to a channel within a Slack workspace.
- Describe how to configure an alert receiver using both openhift UI and YAML configuration.
1. Creating a cluster monitoring ConfigMap object
First we create a cluster-monitoring-config ConfigMap object and enable user workload monitoring if the ConfigMap object does not already exist.
- Run:
oc -n openshift-monitoring get configmap cluster-monitoring-configto check whether the cluster-monitoring-config ConfigMap object exists. If the ConfigMap object does not exist, create a YAML file called:cluster-monitoring-config.yamland add the following configuration:
apiVersion: v1
kind: ConfigMap
metadata:
  name: cluster-monitoring-config
  namespace: openshift-monitoring
data:
  config.yaml: |
    enableUserWorkload: true
- Apply the above config using:
oc apply -f cluster-monitoring-config.yaml
2. Creating a user workload monitoring configmap object
To further configure monitoring for user-defined project with supported configurations, a user-workload-monitoring-config ConfigMap should also exist.
- Run
oc -n openshift-user-workload-monitoring get configmap user-workload-monitoring-configto check if theuser-workload-monitoring-configalready exists. If the ConfigMap object does not exist, create a YAML file:user-workload-monitoring-config.yamland add the following configuration:
apiVersion: v1
kind: ConfigMap
metadata:
  name: user-workload-monitoring-config
  namespace: openshift-user-workload-monitoring
data:
  config.yaml: |
- Run:
oc apply -f user-workload-monitoring-config.yamlto apply the configuration.
3. Deploying a sample service
To test monitoring of user-defined projects, we deployed a sample service from the official OpenShift documentation using the below steps. This automatically creates an ns1 namespace for the service.
- Create a YAML file:
prometheus-example-app.yamlfor the service configuration. - Add the following deployment and service configuration details to the created YAML file.
apiVersion: v1
kind: Namespace
metadata:
  name: ns1
---
apiVersion: apps/v1
kind: Deployment
metadata:
  labels:
    app: prometheus-example-app
  name: prometheus-example-app
  namespace: ns1
spec:
  replicas: 1
  selector:
    matchLabels:
      app: prometheus-example-app
  template:
    metadata:
      labels:
        app: prometheus-example-app
    spec:
      containers:
      - image: ghcr.io/rhobs/prometheus-example-app:0.4.0
        imagePullPolicy: IfNotPresent
        name: prometheus-example-app
---
apiVersion: v1
kind: Service
metadata:
  labels:
    app: prometheus-example-app
  name: prometheus-example-app
  namespace: ns1
spec:
  ports:
  - port: 8080
    protocol: TCP
    targetPort: 8080
    name: web
  selector:
    app: prometheus-example-app
  type: ClusterIP
- Apply the configuration:
oc apply -f prometheus-example-app.yamlto create the service.
4. Creating a ServiceMonitor
Using the below steps, we created the sample ServiceMonitor for the sample service created in the previous section. The service monitor will scrape metrics exposed by our sample service.
- Create a YAML file file:
example-app-service-monitor.yamland add the following configurations:
apiVersion: monitoring.coreos.com/v1
kind: ServiceMonitor
metadata:
  labels:
    k8s-app: prometheus-example-monitor
  name: prometheus-example-monitor
  namespace: ns1
spec:
  endpoints:
  - interval: 30s
    port: web
    scheme: http
  selector:
    matchLabels:
      app: prometheus-example-app
- Run
oc apply -f example-app-service-monitor.yamlto apply the configuration and create the service monitor.
5. Creating an Alerting Rule
In our prometheus-example-app, the version metric is exposed and image version is 0.4.0 as seen in the YAML configuration. This prometheus alerting rule from the OpenShift documentation allow us to get an alert if the deployed image version is ever = 0 with the expression: expr: version{job="prometheus-example-app"} == 0. To keep the alert continously firing for testing purposes, we have modified the alerting rule as seen below to fire if image version is less than 2 using the expression: expr: version{job="prometheus-example-app"} < 2. The alert will always be in firing state as image version is 0.4.0 and less than 2.
apiVersion: monitoring.coreos.com/v1
kind: PrometheusRule
metadata:
  name: example-alert
  namespace: ns1
spec:
  groups:
  - name: example
    rules:
    - alert: VersionAlert
      expr: version{job="prometheus-example-app"} < 2
6. Setting up Slack
In this session, we will configure Slack as an alert receiver for our OpenShift alerts. Our aim is to receive a message on slack when a defined threshold or condition is an alerting rule has been reached. In this case, we want the to trigger an alert when version < 2.
- First, we log on to Slack and create a new workspace. We can also use an existing workspace. In this example, our workspace is
Openshift-Alerts. - Next we create a slack application if this has not been previously created. Access Create a slack app, then select
Create an app > From scratch. - Enter a name for the app. We call our slack app:
Openshift-Alerts-Slack.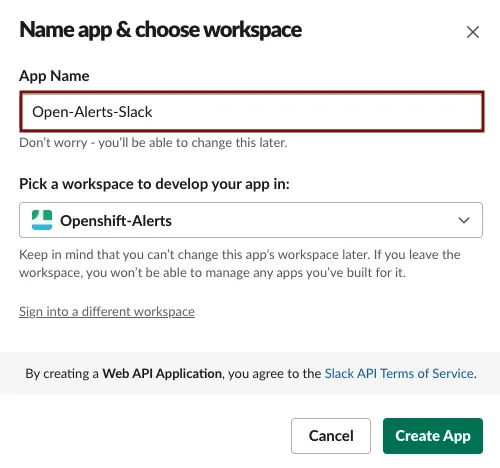
- Pick a workspace to develop your app in and select
Create App.
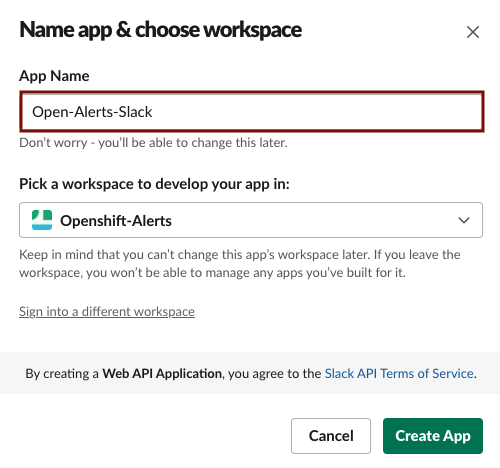
- In this example, we use our
Openshift-Alertsworkspace created in step 1.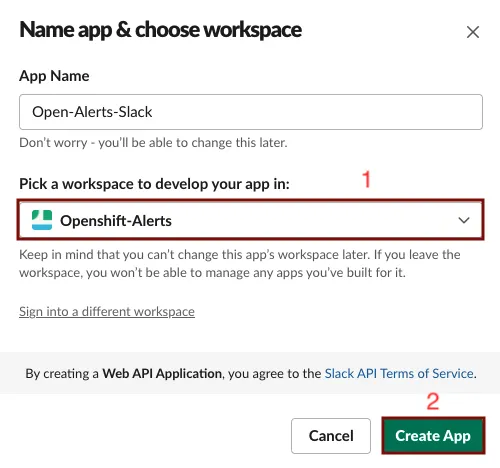

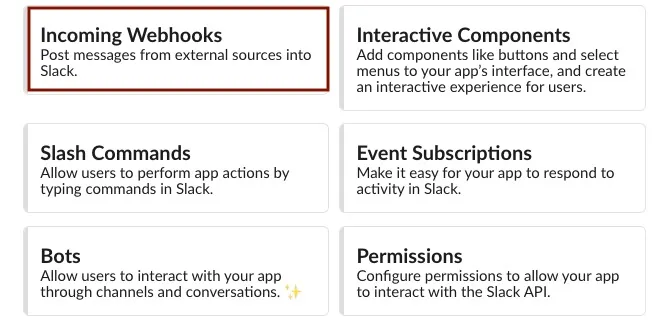
-
On the next page showing additional information for the newly created app, select incoming webhook.
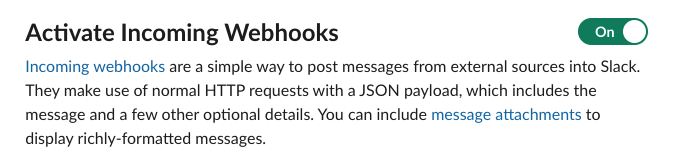
-
On the Incoming Webhooks page, toggle the
Activate Incoming webhookto turn the feature ON.
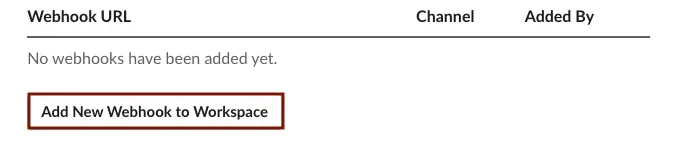
-
On the same Incoming Webhook page, select the
Add New Webhook to Workspacebutton at the button of the page.
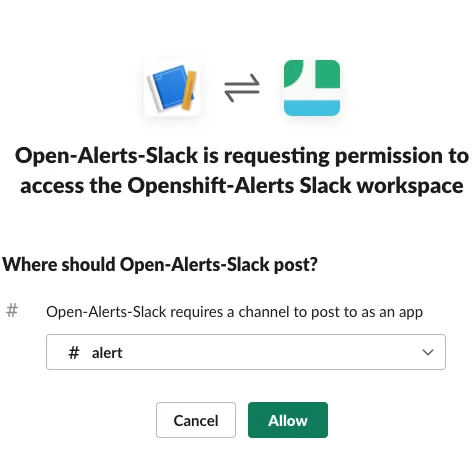
-
Select the channel in the Slack workspace where the slack app should post alerts to, and then select
Allow. in our example, our slack app is posting in the#alertchannel within the previously providedOpenshift-Alertsworkspace. See how to create a slack channel
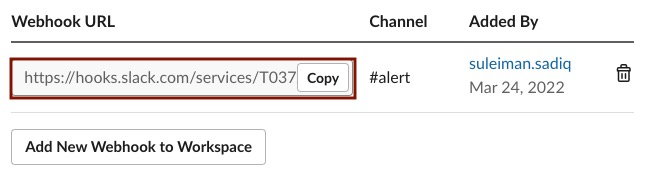
-
We are redirected back to the slack
app settingswith ourWebhook URLprovided in theWebhook URLs for Your Workspacesection on the buttom of the page. Copy the URL by selectingCopyas we will need to provide this in our OpenShift configuration.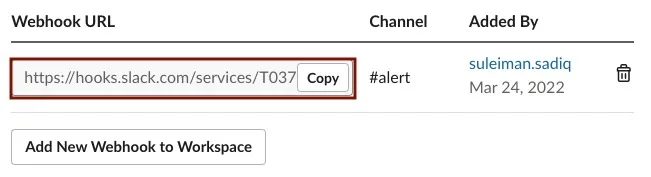


7. OpenShift Alertmanager Configuration
We will now configure alert manager in OpenShift to route alerts from a specific namespace to Slack. We will need to be logged on as cluster-admin to configure alert manager.
- Log on to Openshift console as
cluster-admin. - From the left menu, select
Administration > Cluster settings. - On the Cluster Settings page, select
Configuration > Alertmanager. - On the Alertmanager page, select
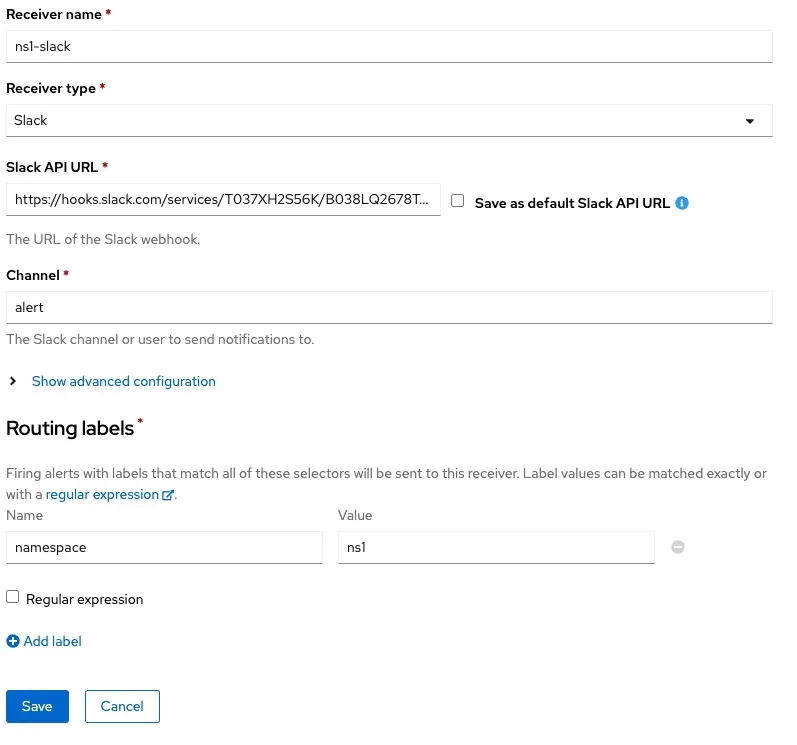
Create Receiver. - Enter a name for Receiver and select
Slackas receiver type. In this example, the receiver name isns1-slack. - In the
Slack API URLbox, paste the copied Webhook URL from slack. - In the channel box, provide the slack channel name (without the #) to post alerts to as previously specified. This is also the same channel shown beside your Webhook URL in the slack app settings page. In our example, the channel is
alert. - In the router labels section, enter
namespacefor Name andns1for Value, to route alerts from thens1namespace to our slack workspace. - Select save. We should start receiving firing alerts within our namespace in a few seconds. In our example, the previously created and already firing VersionAlert is immediately posted to our Slack channel.
-
This is what our configuration in OpenShift Alertmanager looks like:
-
This is what the YAML code for the above configuration looks like below.

global:
  resolve_timeout: 5m
inhibit_rules:
  - equal:
      - namespace
      - alertname
    source_matchers:
      - severity = critical
    target_matchers:
      - severity =~ warning|info
  - equal:
      - namespace
      - alertname
    source_matchers:
      - severity = warning
    target_matchers:
      - severity = info
receivers:
  - name: Default
  - name: ns1-slack
    slack_configs:
      - channel: alert
        api_url: >-
          https://hooks.slack.com/services/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
  - name: Watchdog
route:
  group_by:
    - namespace
  group_interval: 5m
  group_wait: 30s
  receiver: Default
  repeat_interval: 12h
  routes:
    - matchers:
        - alertname = Watchdog
      receiver: Watchdog
    - receiver: ns1-slack
      match:
        namespace: ns1
- To add, view or update the YAML configuration, perform the below steps:
- Log on to the openshift console as
cluster-admin. - From the left menu, select
Administration > Cluster Settings > Configuration > Alertmanager. - In the Alertmanager page, select
YAML, provide/update the YAML configuration and select apply.
- Log on to the openshift console as
- This is what the slack posted to our OpenShift-Alerts workspace in Slack looks like:

7. Conclusion
We have successfully enabled monitoring for user-defined projects, deployed a sample service, created an alerting rule and integrated Slack as an alert receiver. Although we have focused on configuring slack on OpenShift Alertmanager, the steps to configure other supported receiver types within OpenShift remains same.
This is only an example of how alerting rules can be used in OpenShift. When developing applications and services, we can include the Prometheus library which is available in most popular languages to expose application level metrics. We can also create alerting rules for platform metrics such as how much CPU, memory and bandwidth is being consumed within a namespace.
关于作者


产品
工具
试用购买与出售
沟通
关于红帽
我们是世界领先的企业开源解决方案供应商,提供包括 Linux、云、容器和 Kubernetes。我们致力于提供经过安全强化的解决方案,从核心数据中心到网络边缘,让企业能够更轻松地跨平台和环境运营。