
Kubernetes monitoring helps engineers (SRE, performance, and DevOps) to identify performance issues, including insufficient resources, high CPU usage, and pod failures, across a Kubernetes (K8s) environment.
Prometheus simplifies the management of your containerized applications by tracking uptime, cluster resource utilization, and interactions among cluster components. This article provides an overview of essential API-related metrics you should be collecting, and the best practices for monitoring them.
To get a better understanding of API performance metrics, you need to know how Kubernetes application workloads are created, and how they run on Kubernetes and Red Hat OpenShift.
As an example, take a look at the deployment of a typical application workload in Kubernetes:
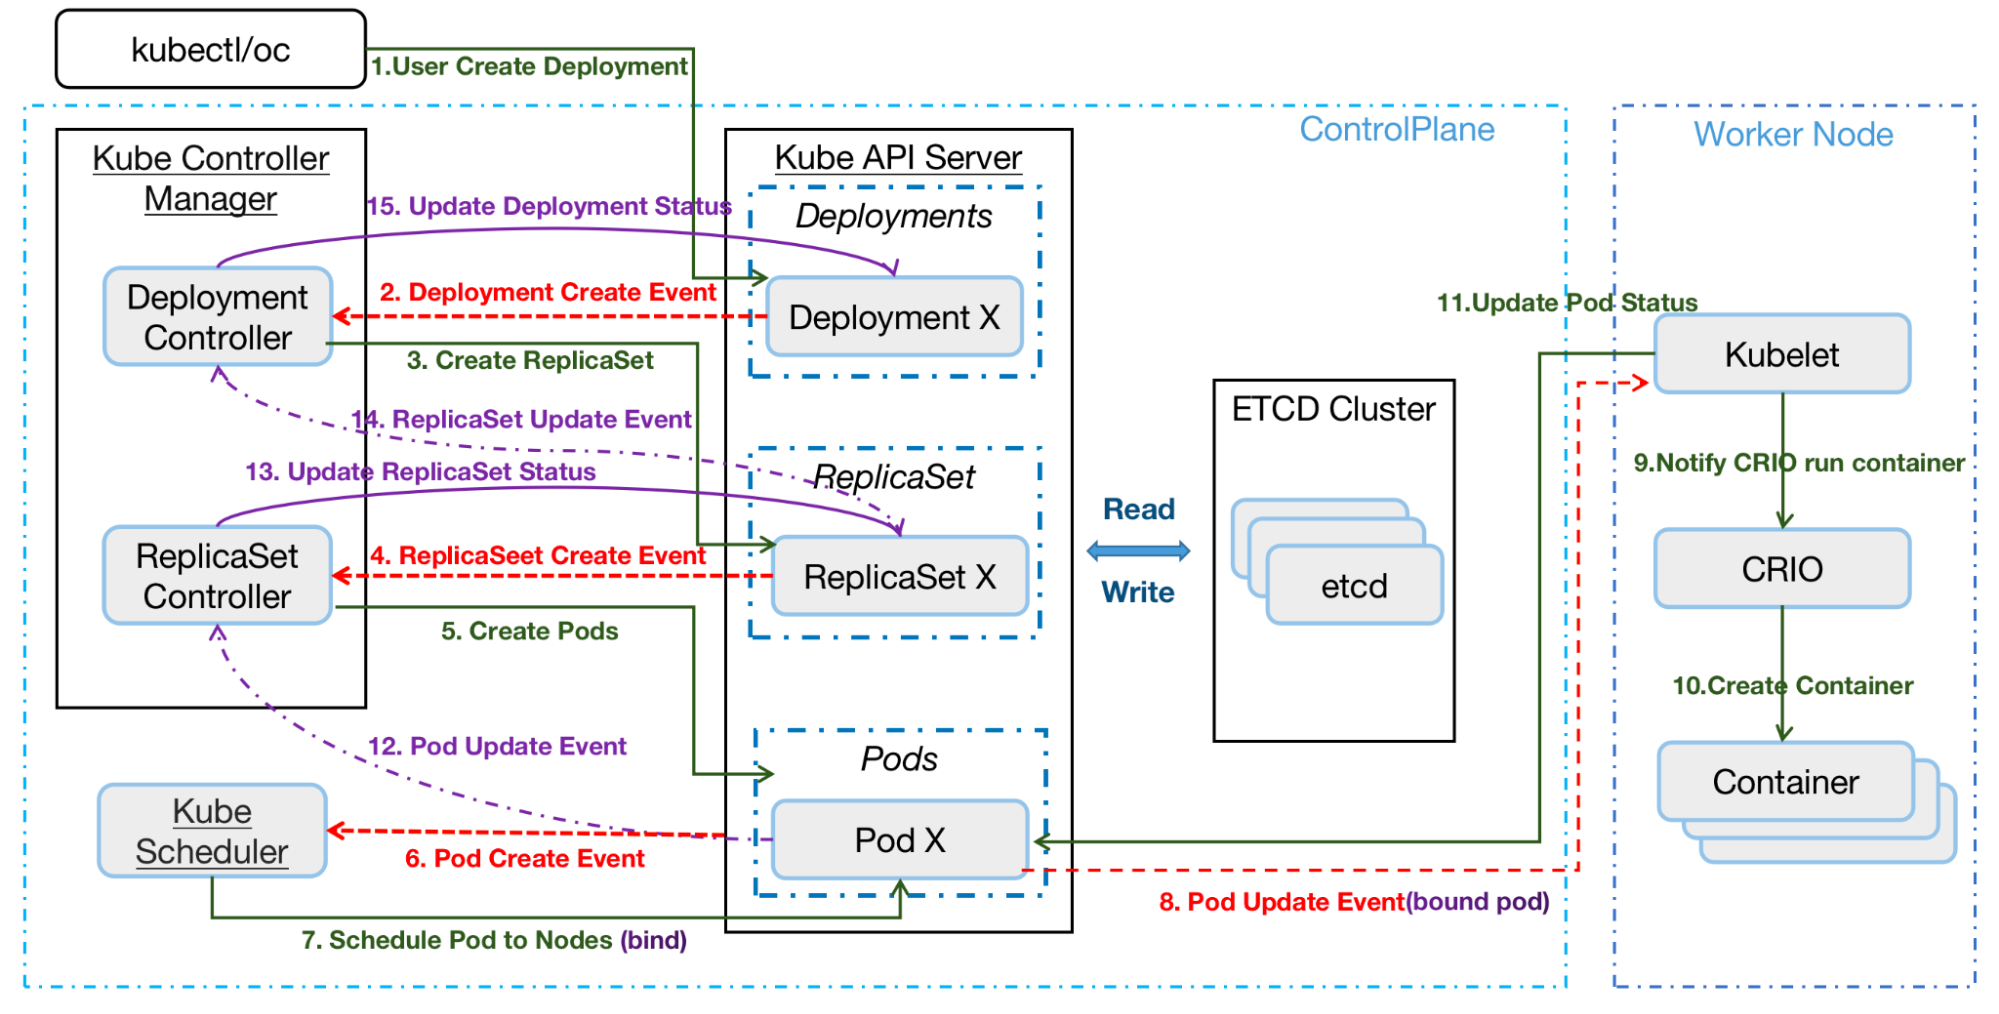
The general workflow:
User creates a Deployment using a REST API or the command line.
API Server (kube-apiserver) writes the Deployment spec into etcd.
The DeploymentController watches for new Deployments to create an event and takes action to reconcile against the Deployment spec and create a ReplicaSet manifest, then posts them to API server and writes the ReplicaSet spec into etcd.
The ReplicaSet controller watches for the ReplicaSet created event, and creates the new Pod manifests. It posts them to the API server and writes the Pod spec into etcd.
The Scheduler watches pod creation events and detects an unbound Pod. It schedules and updates the Pod's Node binding.
Kubelet, running on the node, detects a new Pod scheduling and executes it using the Container runtime (for example, cri-o).
Kubelet retrieves the Pod status through the Container runtime and updates it to the API Server. General Deployment create events are available with the kubectl get event -n namespace command.
What is a Kubernetes API server?
The API server (kube-apiserver) is a front-end component of the Kubernetes control plane that exposes the Kubernetes API. The API Server is responsible for all operations related to the distributed storage component etcd datastore, and the only component that directly talks with etcd. All other components communicate through a unified REST API. Controller Manager, scheduler, Kube proxy, and Kubelet monitor resource changes through a list-watch API and take corresponding actions on resources.
Observing the metrics of API Server
Observing the metrics of kube-apiserver will let you detect and troubleshoot latency, errors and validate that the service performs as expected.
How many requests does kube-apiserver receive from different clients?
The counter vector of apiserver_request_total can be used to monitor the requests to apiserver, from where they are coming, which action and whether they were successful. You can query the requests per second of the apiserver from all clients from Prometheus with this PromQL:
sum by(resource, code, verb, system_client)
(irate(apiserver_request_total{job="apiserver"}[5m]))
To analyze what API requests occur during our “creating a Deployment workload”, we can narrow the query range by limiting the client to be non-empty.
sum by(resource, code, verb, system_client)
(irate(apiserver_request_total{job="apiserver", system_client!=""}[5m]))
Queries Per Second (QPS) of API Server by Client
You can see that the POST and PUT requests of kube-controller-manager and kube-scheduler increased due to Deployments, ReplicaSets and Pods created. This is due to creating, updating, and deleting primary resources via the standard HTTP verbs (POST, PUT, PATCH, DELETE).
You can also get the Read Request Success Rate and Write Request Success Rate:
Read Request Success Rate
sum(irate(apiserver_request_total{code=~"20.*",verb=~"GET|LIST"}[5m]))/sum(irate(apiserver_request_total{verb=~"GET|LIST"}[5m]))Write Request Success Rate
sum(irate(apiserver_request_total{code=~"20.*",verb!~"GET|LIST|WATCH|CONNECT"}[5m]))/sum(irate(apiserver_request_total{verb!~"GET|LIST|WATCH|CONNECT"}[5m]))Also, kube-apiserver exposes a histogram vector of apiserver_request_duration_seconds_bucket. This metric measures the latency for each request to the Kubernetes API server in seconds. Data is divided into different categories, such as verb, group, version, resource, component, and so on. You can use a histogram_quantile to observe how latency is distributed among verbs:
topk(3, cluster_quantile:apiserver_request_duration_seconds:histogram_quantile{job="$job",quantile="0.9", subresource=""})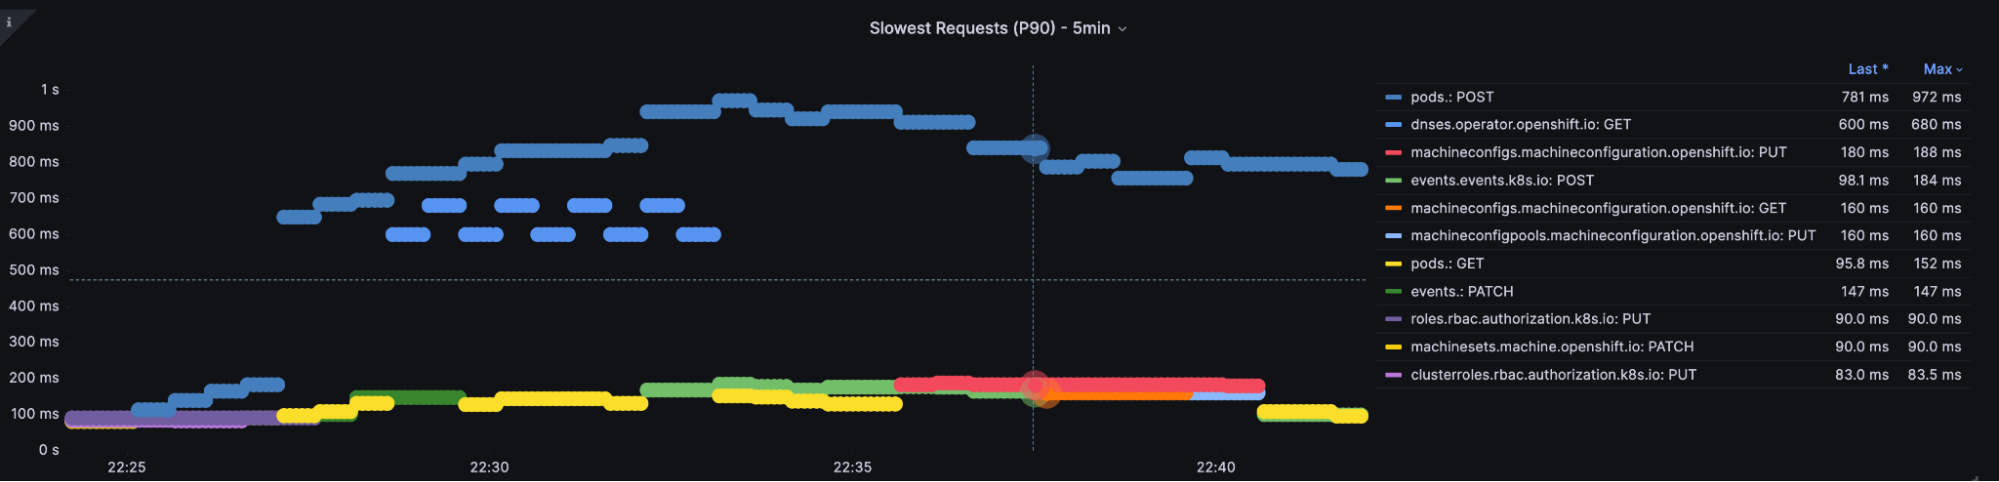
Slowest Requests
Another important metric is process_cpu_seconds_total, the total user and system CPU time spent in seconds:
(irate(process_cpu_seconds_total{job=~"apiserver|kube-controller-manager|scheduler|
etcd"}[1m]))
You can use the above PromQL to get how many CPU seconds that apiserver, kube-controller-manager, etcd, and scheduler consume.
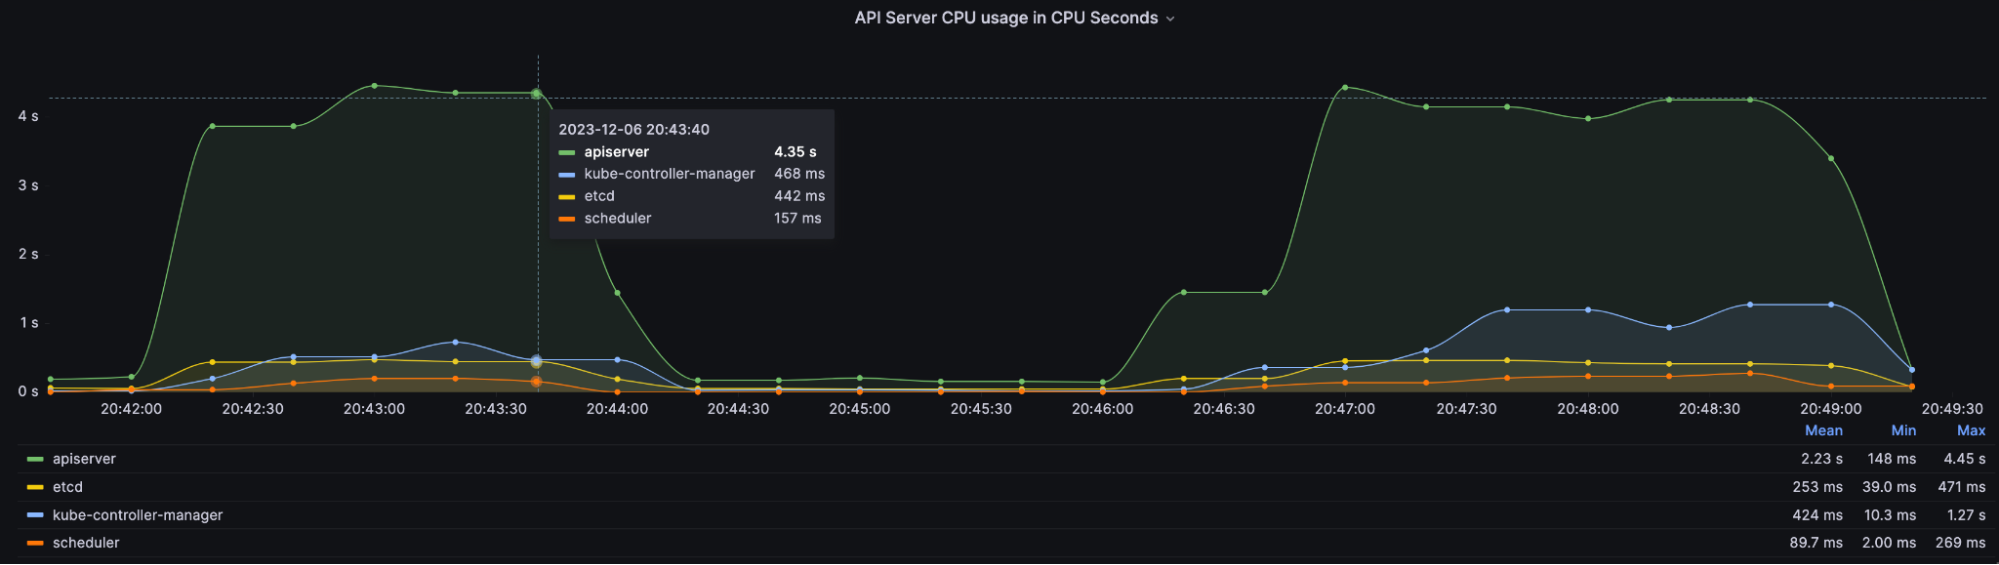
API Server CPU Usage in CPU Seconds
You also need to consider admission controller latency. The admission controller intercepts requests to the Kubernetes API server prior to persistence of the object, but after the request is authenticated and authorized.
Admission controllers may be validating, mutating, or both. Mutating controllers may modify objects related to the requests they admit. Validating controllers may not.
Admission controllers limit requests to create, delete, modify objects. Admission controllers can also block custom verbs, such as a request that connects to a Pod over an API server proxy. Admission controllers do not (and cannot) block requests to read (get, watch or list) objects.
Admission checks that an object can be created or updated by verifying cluster global constraints and might set defaults depending on the cluster configuration.
Kube-apiserver exposes a histogram vector of apiserver_admission_controller_admission_duration_seconds_bucket and apiserver_admission_controller_admission_duration_seconds_bucket to get metrics of admission and webhook.
Admission Controller Latency [admit]
histogram_quantile(0.99, sum by(le, name, operation, rejected, type) (irate(apiserver_admission_controller_admission_duration_seconds_bucket{$job="kube-apiserver", type="admit"}[5m])))Admission Controller Latency [validate]
histogram_quantile(0.99, sum by(le, name, operation, rejected, type) (irate(apiserver_admission_controller_admission_duration_seconds_bucket{$job="kube-apiserver", type="validate"}[5m])))The QPS of the admission webhook.
sum by(name, operation, rejected, type) (irate(apiserver_admission_webhook_admission_duration_seconds_count[5m]))Observing the metrics between the API server and etcd datastore
The etcd cluster stores the configuration data, state data, and metadata in Kubernetes. Several keys are created in the etcd datastore after creating the Deployment workload. Find all keys in the datastore using etcdctl get --keys-only --prefix /
The kube-apiserver exposes a histogram vector of etcd_request_duration_seconds_bucket that observes the api request latency between kube-apiserver and etcd. You can get the latency from this PromSQL:
sum by(le) (increase(etcd_request_duration_seconds_bucket{job="$job"}[1m]))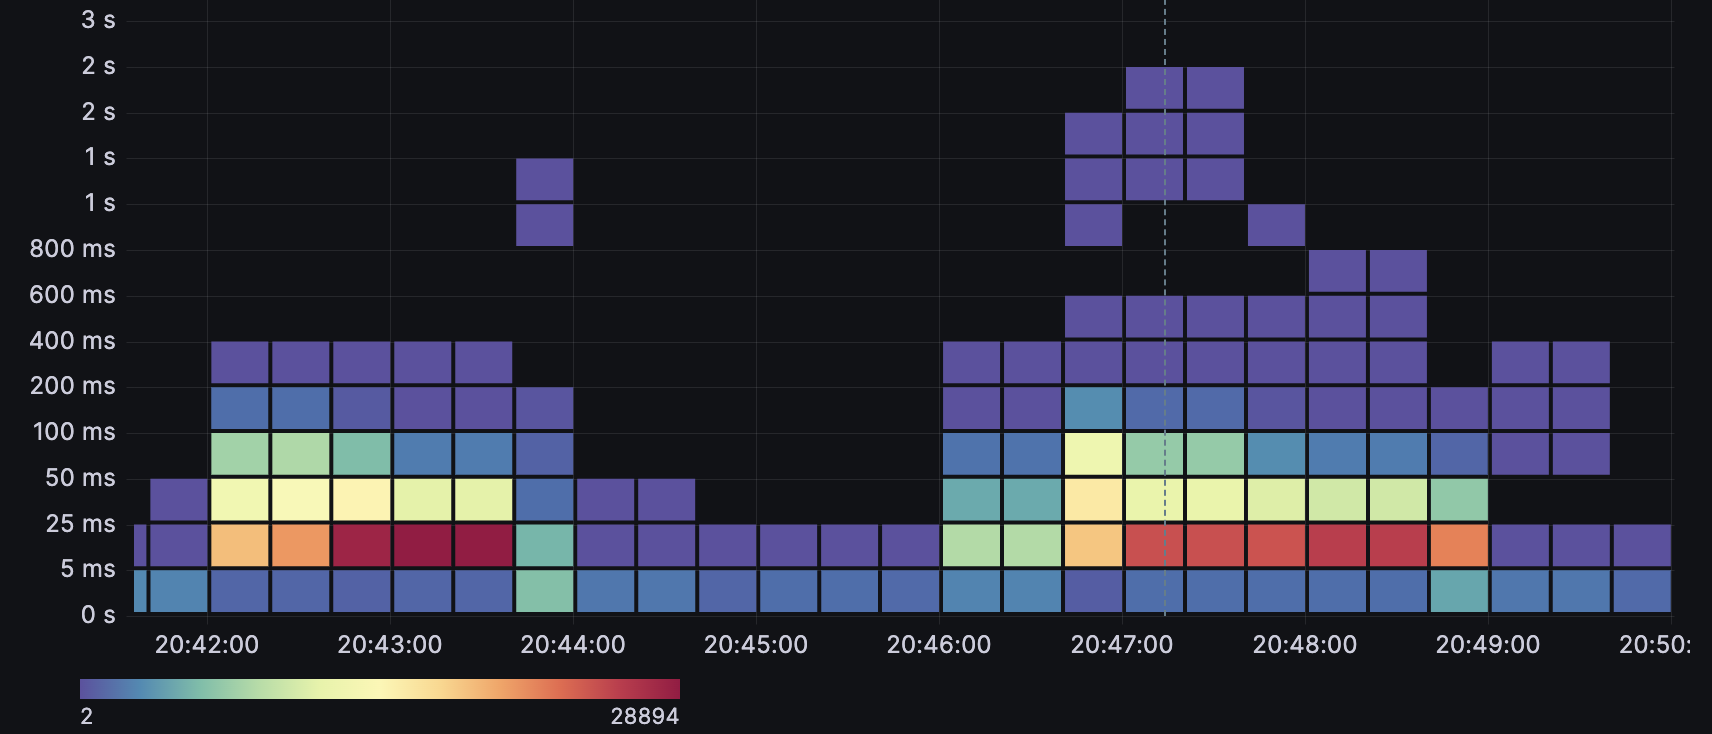
Etcd Request Latency
The above graphic shows the trend of etcd request latency. The latency increases when creating multiple Deployments in parallel. Most of the request times are less than 100ms, however a few of the outlier requests are close to 2s.
Observing the metrics between API server and other components
The kube-controller-manager, kube-scheduler and kubelet are core components of Kubernetes. These components are clients interacting with API servers via LIST/WATCH mechanism.
The metric rest_client_request_duration_seconds_bucket measures the latency or duration in seconds for calls to the API server. It is a good way to monitor the communications between the kube-controller-manager, kubelet, or scheduler, and other components and the API, and check whether these requests are being responded to within the expected time. Such information can be useful in determining whether your cluster is experiencing performance degradation.
histogram_quantile(0.99, sum by(le, service, verb) (rate(rest_client_request_duration_seconds_bucket{job=~"kube-controller-manager|scheduler|check-endpoints|kubelet"}[1m])))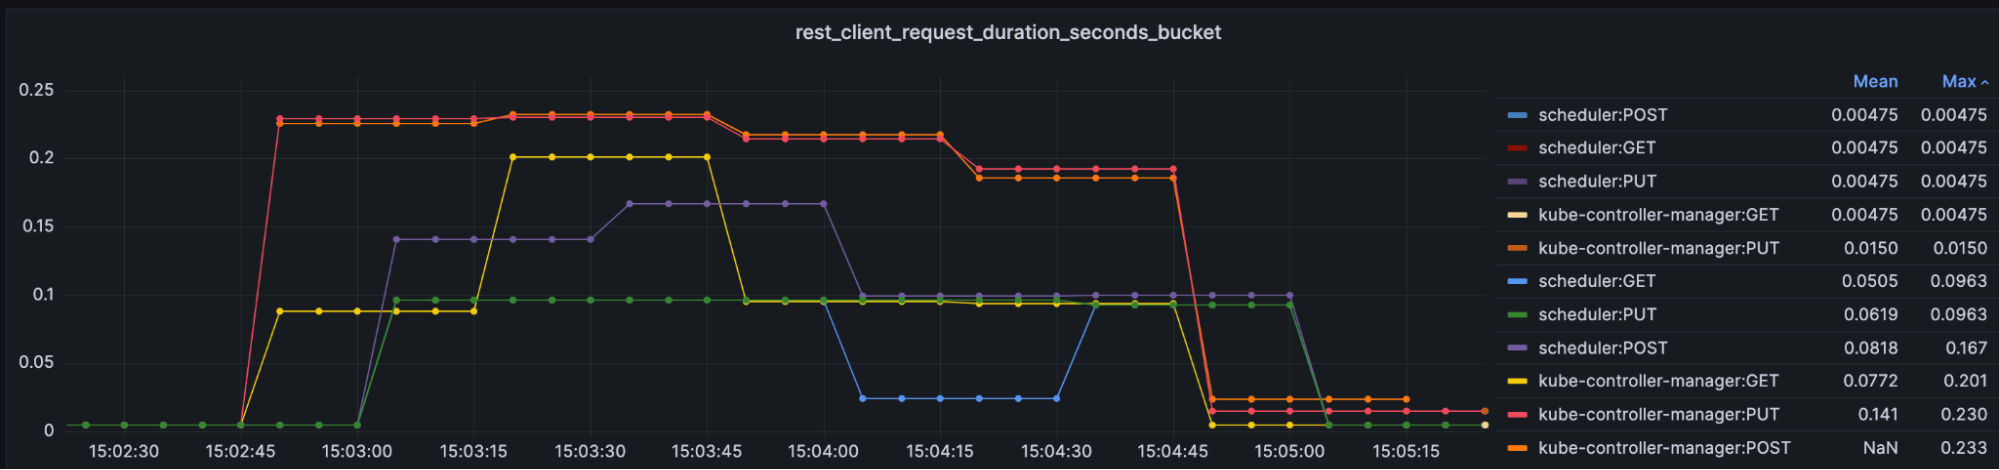
Kube API Request Latency by Client
In the above graphic, the POST and PUT durations increase a lot more than during normal conditions due to 400 Deployments created in parallel.
You can get the QPS from a different client perspective:
sum by(method, container, code) (rate(rest_client_requests_total{job=~"kube-controller-manager|scheduler|check-endpoints|kubelet"}[1m]))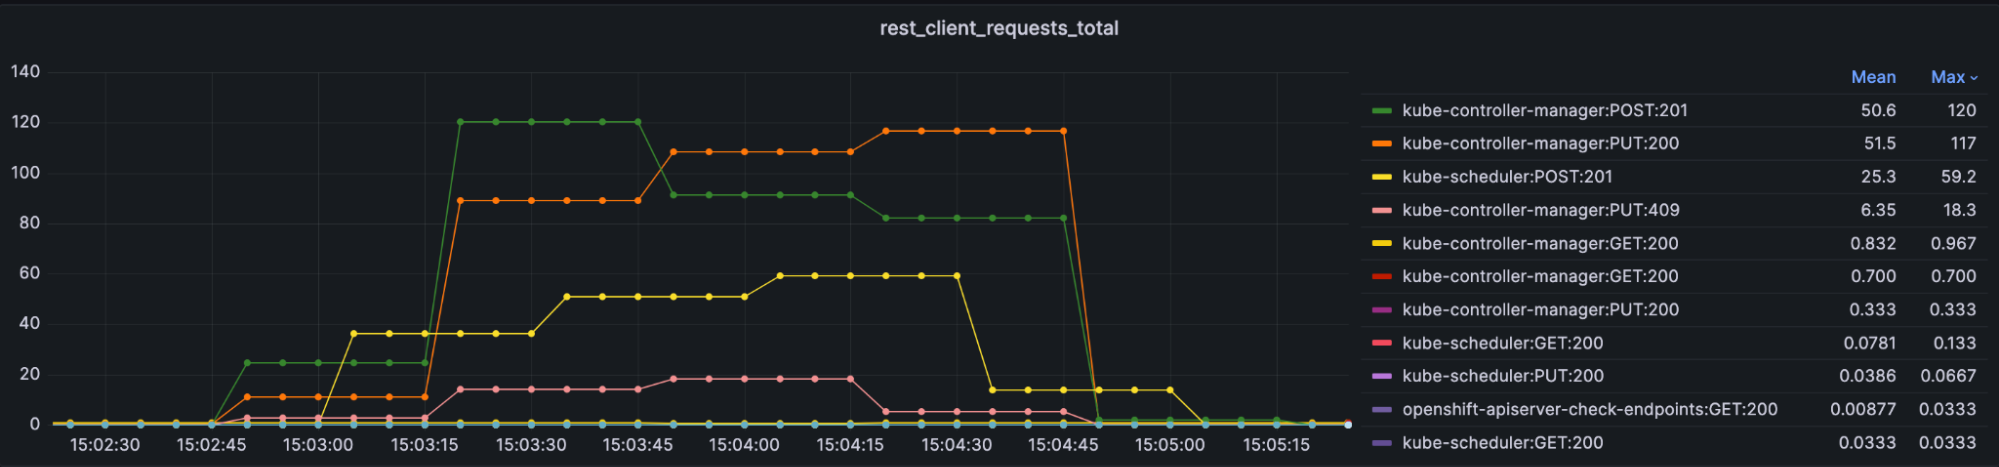
Total Kube API Client Request
What’s the difference between rest_client_requests_total and apiserver_request_total? They differ in whether or not requests from Kubernetes components are included.
apiserver_request_total: The total number of requests processed by all apiservers. Includes requests received directly from Kubernetes components and other clients. Summarizes all request types in one time series. Labeled by system-client, group, resource type (Pod, Service, Deployment, etc.), subresource, verb, scope.
rest_client_requests_total: The number of requests sent to the apiserver via a REST client (e.g. kube-controller-manager). These requests may be operations to query, modify, create, or delete Kubernetes resources. This time series is tagged by http method (GET, POST, PUT, DELETE, etc.) and is labeled by service, host, instance, namespace, pod, container and code.
In addition to API server related metrics, we can access other relevant metrics to identify your cluster performance.
For Kubernetes controllers, each controller has two main components: the Informer/SharedInformer and the work queue. Through these components, controllers regulate and maintain the cluster state. When an object or resource is changed, the Resource Event Handler puts a key into the work queue.
Work queue addition rate
How fast new actions are scheduled to be performed by the controller. These actions can include additions, deletions and modifications of any resource in the cluster (workloads, configmaps, services).
Use the following query to retrieve the addition rate of the workqueue:
sum(rate(workqueue_adds_total{k8s_app="kube-controller-manager"}[5m])) by
(instance, name)
For the creating multiple Deployments in parallel scenario, you can narrow down the scope of query like this:
sum by(name) (rate(workqueue_adds_total{job=~"apiserver|kube-controller-manager|scheduler|kubelet",name=~"garbage_collector_graph_changes|
admission_quota_controller|endpoint|endpoint_slice|endpoint_slice_mirroring|
deployment|replicaset|AvailableConditionController"}[1m]))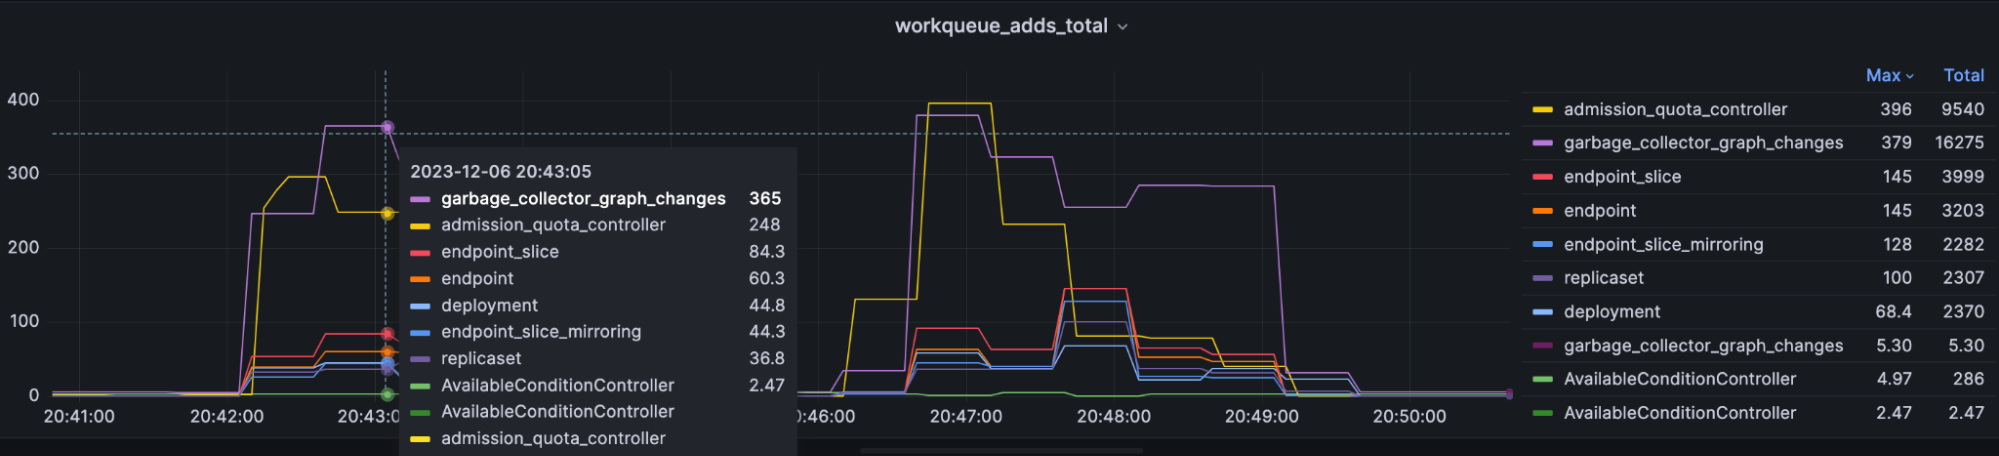
The Rate of Addition in Workqueue
Work queue latency
How fast is the controller-manager performing these actions?
Use the following query to represent the workqueue latency through quantiles. This metric is the number of required actions the kube-controller-manager takes per unit time. A higher rate indicates a problem in some of the nodes’ clusters.
histogram_quantile(0.99, sum by(name, le) (rate(workqueue_queue_duration_seconds_bucket{job=~"kube-controller-manager", name=~"deployment|replicaset|endpoint|endpoint_slice|endpoint_slice_mirroring"}[5m])))
Work Queue Latency
Work queue depth
How many actions in the workqueue are waiting to be processed.
Use the following query to retrieve the depth of the work queue, this metric is the number of actions lined up in the queue and which the kube-controller-manager has to perform:
sum(rate(workqueue_depth{job="kube-controller-manager"}[5m])) by (instance, name)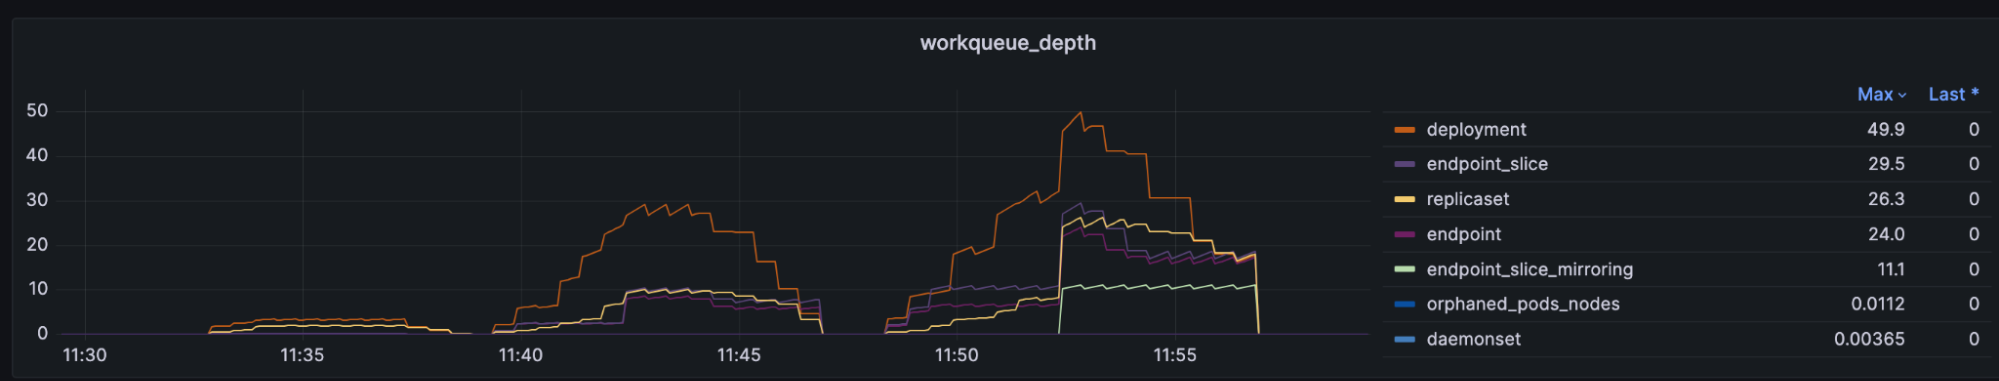
Work Queue Depth
The ideal values should be low (recommend less than 10). If the queue length is too high and is in the state for a long time, it means a large number of services pending for synchronization exist in the workqueue. To fix this, the change frequency of Node, Pod and Service in the cluster should be appropriately reduced. Above result is simulating to create a large number of deployments in parallel. Although there is a peak of the work queue. The length is more than 10, but it returns to normal soon, so it’s not a problem. More metric about work queue and others on kubernetes can be find in Kubernetes Metrics Reference
This article has introduced some examples that explore the API performance related metrics of the Openshift/Kubernetes API. To identify cluster bottlenecks, API performance metric monitoring is one key technique, but it’s not enough. We also need to observe CPU/RAM usage, disk IO, network latency etc. Openshift/Kubernetes provides user-friendly dashboards. There are also open source solutions such as prometheus-operator to help monitor cluster performance and make the SRE or admins life easier.
References:
关于作者


产品
工具
试用购买与出售
沟通
关于红帽
我们是世界领先的企业开源解决方案供应商,提供包括 Linux、云、容器和 Kubernetes。我们致力于提供经过安全强化的解决方案,从核心数据中心到网络边缘,让企业能够更轻松地跨平台和环境运营。