The memory subsystem is one of the most critical components of modern server systems--it supplies critical run-time data and instructions to applications and to the operating system. Red Hat Enterprise Linux provides a number of tools for managing memory. This post illustrates how you can use these tools to boost the performance of systems with NUMA topologies.
Practically all modern multi-socket server systems are non-uniform memory access (NUMA) machines where local memory is directly connected to each processor. While memory attached to other CPUs is still accessible – access comes at the cost of reduced performance. The result is “non-uniform” access times. The art of managing NUMA lies in achieving affinity between CPUs and memory by placing and binding application processes to the most suitable system resources.
Until Red Hat Enterprise Linux 7, optimizing NUMA memory management was a manual process; a process best left in the hands of experts. Red Hat Enterprise Linux 7 broke new ground with the inclusion of an automatic NUMA balancing feature that achieves results close to what a performance specialist could provide.
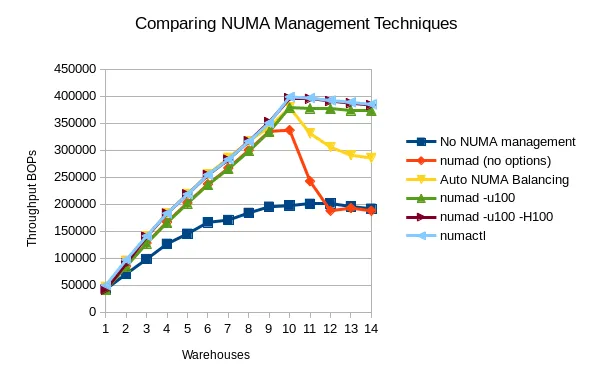
The following chart (see below) shows the results of various NUMA management techniques on a Java workload executed on x86 hardware. The dark blue line (at the bottom) shows the throughput when no NUMA management is used at all. The yellow line (paralleling the light blue line) shows the significant improvement that Red Hat Enterprise Linux 7 brings by default with automatic NUMA balancing. No user or administrator effort is necessary at all, and the automatic NUMA balancing feature achieves nearly optimal results for this workload on this system. (Note the system is oversubscribed after 10 warehouses, so most of the results tend to fall off after that point.) The default, out-of-the-box results on Red Hat Enterprise Linux 7 are (now) good enough that most users with similar loads should just run their workload and let the kernel automatic NUMA balancing functionality optimize the NUMA system performance for them.
The light-blue line shows what can be achieved by an expert performance engineer using static manual binding via the numactl command. The brown line (mostly hidden under the light-blue line), the green line, and the red line show numad results with different options. The red line on the graph shows the performance with numad running with no options specified. It starts to fall off after 9 warehouses because numad tries to preserve an available resource margin when the utilization reaches 85%. Default numad results rapidly degrade in this case when the CPUs are oversubscribed. If the user specifies that numad should aim for 100% utilization—shown by the green line—numad achieves about the same peak performance improvement as the kernel automatic NUMA balancing functionality does for 10 warehouses. (note: the kernel automatic NUMA performance is better for less than 10 warehouses, where the yellow line is actually under the light-blue line) The "numad -u100" performance degrades much more slowly as resources are oversubscribed. This is shown by the green line being relatively flat towards the right edge of the graph.
If you want to learn more about the new automated NUMA balancing or about the manual approach, I’ve captured guidelines for getting optimal performance using the NUMA management tools that are part of Red Hat Enterprise Linux (numad, numactl, and more) in a whitepaper called “Red Hat Enterprise Linux 7: Optimizing Memory System Performance.” The paper provides an overview of how the NUMA memory system works and how it impacts overall system performance. I encourage you to leave thoughts or to ask questions in the comments section (below). Alternatively, feel free to send me feedback about the paper or your experience with NUMA management to refarch@redhat.com.
关于作者
产品
工具
试用购买与出售
沟通
关于红帽
我们是世界领先的企业开源解决方案供应商,提供包括 Linux、云、容器和 Kubernetes。我们致力于提供经过安全强化的解决方案,从核心数据中心到网络边缘,让企业能够更轻松地跨平台和环境运营。


