
Red Hat Trusted Application Pipeline is built on top of Red Hat OpenShift Pipelines and its upstream project, Tekton. We use Tekton’s Pipelines as Code, Tekton Chains and Tekton Results capabilities to provide a more scalable build environment with an enhanced security posture to power Red Hat's next-generation build systems. According to the product description:
OpenShift Pipelines is designed to run each step of the CI/CD pipeline in its own container, allowing each step to scale independently to meet the demands of the pipeline.
But what do we mean by "scaling independently?" What happens when lots of developers need to run builds or other CI/CD actions simultaneously?
At Red Hat, we have gained a lot of experience running OpenShift Pipelines at scale, especially when working on Trusted Application Pipeline. The Trusted Application Pipeline motto is to build apps in five clicks and five minutes. This blog focuses on the "five minutes" aspect.
We defined two Key Performance Indicators (KPIs) while working on performance and scale testing of Trusted Application Pipeline:
- Basic pipelines finish in five minutes or less.
- Advanced pipelines finish in eight minutes or less.
This blog shares some generic learnings applicable to Trusted Application Pipeline or OpenShift Pipelines and any large workload distributing system on OpenShift or Kubernetes.
Environment
Your workflow is called a Pipeline in OpenShift Pipelines. It is composed of tasks, and each task can consist of multiple steps. A task is transformed into a pod, where each step becomes a container within that pod. You can define workspaces where steps and tasks can share data during the pipeline run.
We have been optimizing the duration of the workload used in Trusted Application Pipeline. As it turned out, the most time consuming piece of the pipeline is the build task. This task runs buildah and builds container images as defined in a Dockerfile contained in the user's source code repository. Application source code exists in a workspace volume shared across tasks.
Our tests utilized Red Hat OpenShift Service for AWS (ROSA) clusters.That platform’s hosted control plane technology allows us to rapidly stand up and tear down clusters for scale testing, and a long-running cluster we host provides our service to various teams within Red Hat. Though many of the test details are specific to AWS, we believe these findings would also apply to other cloud providers.
How the KPI test works
As a benchmark, we created a test to execute an arbitrary number of parallel pipeline runs in a loop for a defined time. We measured the average pipeline run duration (and more), and ran the test multiple times, each with more concurrent users, until the average duration crossed five (or eight) minutes (based on the pipeline being tested). Our KPI was the number of concurrent users needed to pass this duration limit.
10 lessons we've learned along the way
1. Make sure local storage is not the bottleneck
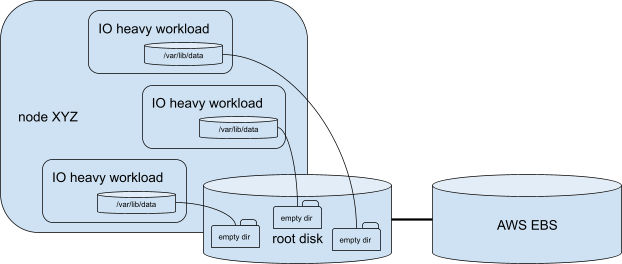
Some AWS Elastic Compute Cloud (EC2) instances mount their root AWS Elastic Block Store (EBS) volume and some use local storage, but no storage type has unlimited performance. If the workload uses a volume of type "EmptyDir", it is actually allocated to the node's local storage (which might be a remotely-mounted AWS EBS volume). So if the workload is highly concurrent and uses this "EmptyDir" heavily, it might easily happen that multiple pods on the same node are competing for root storage throughput, as seen below:
One option to alleviate this bottleneck is to back up "EmptyDir" by node memory via the "medium: memory" option. The drawback of this approach is that in memory, "EmptyDir" counts towards the pod memory limit, so it typically provides far less capacity unless you increase the pod memory limits to account for the amount of space needed by buildah to produce the image. Some interesting Prometheus queries might be:
sum(node_memory_Shmem_bytes{instance=~"..."})… memory used by tmpfs, handy if you are using in-memory EmptyDirs.sum(node_memory_MemTotal_bytes{}-node_memory_MemFree_bytes{}-node_memory_Buffers_bytes{}-node_memory_Cached_bytes{})… memory used by the entire cluster.
Our testing revealed that a write through cache appeared to be employed with the AWS EBS volumes utilized when our EmptyDirs did not employ memory. In the end, our switch to memory for EmptyDirs did not increase memory usage across the cluster. It simply transferred it from each node's memory cache, which was external from the various Linux containers on the system, to the memory associated with our Kubernetes pods/containers.
2. Monitor the PVs count to avoid delays
For clusters running on AWS, EC2 nodes can only have a limited amount of volumes mounted. See Instance volume limits or AWS API requests throttling for how attaching EBS volumes works via the AWS API. Monitor the number of finished PipelineRuns, as they maintain Physical Volume Claims (PVCs). You might also consider different storage providers, like OpenShift Data Foundation.
You can monitor these OpenShift monitoring metrics:
kube_node_status_allocatable{resource="attachable_volumes_aws_ebs"}… number of allocatable volumes available for scheduling.count(kube_volumeattachment_info) by (node)… volume attachment count per node.sum(attachdetach_controller_total_volumes{state="actual_state_of_world"}) - sum(attachdetach_controller_total_volumes{state="desired_state_of_world"})… alpha; what attach/detach controller thinks.
3. Configure pruning of runs
It is highly recommended that you configure the OpenShift Pipelines pruner to delete completed pods.
Besides freeing volumes mounted to nodes (because it deletes completed pods), pruning unneeded OpenShift resources might help with kube-apiserver/etcd performance. Based on your usage pattern, you might require more aggressive pruning than the default, which is once a day.
Note that because it deletes completed pods, it also deletes their logs. If you need these (and more) archived, use Tekton Results or a more general pod log offload mechanism, like Kubernetes Flutentd.
4. Archive data to Tekton Results
To prune old PipelineRuns (to not overload kube-apiserver or its etcd), but to retain the YAML descriptions and logs, archive this data in Tekton Results, allowing you to delete old pipeline and task runs promptly.
It stores the YAML description of the PipelineRun/TaskRun in PostgreSQL (for Trusted Application Pipeline, we use an AWS Relational Database Service (RDS) instance for this purpose) and logs in an object storage backend. Tekton Results can use AWS S3 or Google Cloud Storage (GCS), whose support was recently added upstream and is not yet available in OpenShift Pipelines 1.12.
5. Provide resource requests/limits
At the beginning of our scaling journey, we noticed a suboptimal distribution of pods across the compute plane of the OpenShift cluster. First, we confirmed no unexpected taints, affinity, or topologySpreadConstraints settings existed anywhere. Do this by inspecting the tasks pod YAML.
At the end, we were tuning pod resources specification. OpenShift scheduler does not schedule pods ideally when they have no or very small resource requests/limits. Always providing these settings is recommended, especially for resource heavy pods.
This is also a viable workaround for input/output (IO)-bound pods. Setting big memory requests and limits forces pods to be evenly distributed.
Generally, a workload might be CPU, memory, disk IO or network intensive. Understanding it helps you set up correct resource limits or node (anti)affinity. Use these Prometheus queries to measure these four aspects:
sum(node_namespace_pod_container:container_cpu_usage_seconds_total:sum_irate{cluster="", namespace="...", pod="..."})… CPU usage of a pod.sum(container_memory_rss{job="kubelet", metrics_path="/metrics/cadvisor", cluster="", container!="", namespace="...", pod="..."})… memory usage of a pod.sum(undefined rate(container_fs_reads_bytes_total{id!="", device=~"(/dev.+)|mmcblk.p.+|nvme.+|rbd.+|sd.+|vd.+|xvd.+|dm-.+|dasd.+", cluster="", namespace="...", pod="..."}[5m])undefined +undefined rate(container_fs_writes_bytes_total{id!="", device=~"(/dev.+)|mmcblk.p.+|nvme.+|rbd.+|sd.+|vd.+|xvd.+|dm-.+|dasd.+", cluster="", namespace="...", pod="..."}[5m])undefined)… disk reads and writes of the pod.irate(container_network_receive_bytes_total{namespace="...", pod="..."}[5m])undefined+undefinedirate(container_network_transmit_bytes_total{namespace="...", pod="..."}[5m])… network receive and transmit bytes.
6. Add additional nodes in each availability zone to spread load
We did not hit this issue directly, but our investigation revealed some information. Depending on the workload, some tasks in the pipeline run might share PVCs. Since a PVC needs to stay in the same AWS EC2 availability zone (AZ), make sure that you have enough nodes in each used AZ so the OpenShift scheduler can distribute these tasks.
7. Use cluster autoscaler
If the cluster autoscaler does not work as expected, the following approaches might help.
First, the current autoscaler status information is in the status config map (in OpenShift, look in the "openshift-machine-api" namespace). There are plans upstream to add even more content in the future.
If you're investigating why nodes are not scaled down, this Prometheus query might help:
sum(cluster_autoscaler_unremovable_nodes_count) by (reason)
It shows how many nodes are not scaled down per reason. The reason is a numerical code that maps to actual reasons as seen in this table:
Reason | Reason name | Reason explanation |
1 | ScaleDownDisabledAnnotation | Node can't be removed because it has a "scale down disabled" annotation |
2 | ScaleDownUnreadyDisabled | Node can't be removed because it is unready and scale down is disabled for unready nodes |
3 | NotAutoscaled | Node can't be removed because it doesn't belong to an autoscaled node group |
4 | NotUnneededLongEnough | Node can't be removed because it wasn't unneeded for long enough |
5 | NotUnreadyLongEnough | Node can't be removed because it wasn't unready for long enough |
6 | NodeGroupMinSizeReached | Node can't be removed because its node group is at its minimal size already |
7 | MinimalResourceLimitExceeded | Node can't be removed because it would violate cluster-wide minimal resource limits |
8 | CurrentlyBeingDeleted | Node can't be removed because it's already in the process of being deleted |
9 | NotUnderutilized | Node can't be removed because it's not underutilized |
10 | NotUnneededOtherReason | Node can't be removed because it's not marked as unneeded for other reasons (e.g., it wasn't inspected at all in a given autoscaler loop) |
11 | RecentlyUnremovable | Node can't be removed because it was recently found to be unremovable |
12 | NoPlaceToMovePods | Node can't be removed because there's no place to move its pods to |
13 | BlockedByPod | Node can't be removed because a pod running on it can't be moved (the reason why should be in BlockingPod) |
14 | UnexpectedError | Node can't be removed because of an unexpected error |
It is also handy to look at the taints that cluster autoscaler puts at nodes with this Prometheus query:
kube_node_spec_taint{key=~".*ClusterAutoscaler.*"}
Here is an explanation of the attributes:
- ToBeDeletedByClusterAutoscaler: Used to make the node unschedulable.
- DeletionCandidateOfClusterAutoscaler: Used to mark an unneeded node as preferably unschedulable.
It also has a label "effect" of these taints that signifies what the taint causes.
If you are seeking more insight on what is happening in Cluster autoscaler, the best thing to do is to put the autoscaler verbosity to five. The autoscaler should then show what it does and why. This is configurable in https://console.redhat.com/openshift/ in your cluster "Machine pools" in "Edit cluster autoscaling".
Normally, scale-up decisions should be instant (as the pod is created). Of course, it takes ~10 minutes for new nodes to become available. Scale-down decisions might be delayed by 15 minutes (this is configurable) and should be explained in Autoscaler logs with level five.
You can track the number of nodes with this Prometheus query:
sum(kube_node_status_condition{status="true"}) by (condition)… number of nodes per their condition.
8. Understand the OpenShift scheduler
You may want to understand why the OpenShift scheduler scheduled some pods on some nodes, so here are some ideas on how to get that information.
Scheduler schedules a pod on a selected node based on scoring from multiple scheduler plugins. Details about scores returned by individual plugins are not normally logged. To get this information, increase logging verbosity, gather the log, and then reset the verbosity back to its original value, as it generates loads of log messages and you probably do not want to have this setting long term.
9. Use bundles for Pipelines and Tasks definitions
Trusted Application Pipeline leverages image bundles for storing the definitions and the Task and Pipelines it provides. During our various performance analyses, we analyzed the cost of image-based Task and Pipeline bundle resolution.
Key recommendation
First, we quickly discovered the gross inefficiencies with the original bundle processing API. If you consider YAML, the original bundle API looked like the following:
taskRef:
 name:
   bundle: <image ref>
And the second generation API looked like this:
taskRef:
 resolver: bundles
 params:
   - name: bundle
     value: <image ref>
The second generation API example is much more efficient. This second example is a switch to the Bundles Resolver form of resolution. It eliminated many unnecessary image pulls and greatly benefited performance.
Monitoring bundle usage
There was no monitoring around bundle usage in Tekton when the Trusted Application Pipeline project started. We began contributing upstream to improve that and address our needs.
First, we contributed two metrics on the amount of PipelineRuns waiting on resolution:
tekton_pipelines_controller_running_pipelineruns_waiting_on_pipeline_resolution_counttekton_pipelines_controller_running_pipelineruns_waiting_on_task_resolution_count
Understanding what that gauge metric typically reports for your cluster and then seeing when it exceeds your typical amounts may be a sign that bundle resolution demands have increased on your cluster.
We have also opened case #7116 to get metrics related to the time spent resolving bundle references.
10. If you can't measure it, you can't improve it
You can get lots of interesting insight into what is happening in the OpenShift Pipelines using OpenShift Monitoring Prometheus. As part of our efforts, we provided several metrics to upstream Tekton. At the time of this blog's publishing, we are still working on additional metrics we hope to provide to upstream Tekton in the future. Some handy queries include:
sum(tekton_pipelines_controller_running_pipelineruns_count)… number of currently running PipelineRuns.sum(tekton_pipelines_controller_running_pipelineruns_count)… number of currently running PipelineRuns.sum(tekton_pipelines_controller_workqueue_depth)… count of pending events to be processed by Pipelines controller.sum(tekton_pipelines_controller_running_taskruns_throttled_by_node_count)… how many times task run was throttled by insufficient node count.sum(tekton_pipelines_controller_running_taskruns_throttled_by_quota_count)… how many times task run was throttled by resources quota.
Also, check the Kubernetes API service in OpenShift dashboard to see if the Kubernetes API is a bottleneck.
Wrap up
The most important takeaway from this article is to "understand your workload bottlenecks and focus on them."
There is no simple answer when it comes to OpenShift Pipelines performance. First, it is tightly coupled with OpenShift itself, and OpenShift performance tuning is a huge subject. Second, every deployment and workload is different, with different bottlenecks.
We provided some best practices collected during our performance and scale work on Trusted Application Pipeline. Hopefully, these will be helpful and give you some ideas about what to investigate.
关于作者


I’ve been a software engineer for more than 20 years, I was a manager for 3 years, and I have been a security focal since 2018. I’ve worked in research, consulting, web portals, IT systems management, cloud computing, hybrid cloud, deployment automation, web platform development and operations, and most recently, developer tools for Kubernetes and DevOps.
My specialties are DevOps, cybersecurity, CI/CD, cloud computing, distributed systems, agile development, and high availability / disaster recovery.
In my free time, I enjoy reading, scuba diving, travel, games, and having fun with my husband, two daughters, and the family dog.
I started as a quality engineer for some Red Hat Enterprise Linux packages, then worked on Red Hat Satellite 5 and 6 and finally moved to Performance and Scale engineering where I'm working on multiple products, testing their limits. I like gardening and graphs.

Starting in June 2015 at Red Hat, I have worked either on core OpenShift or various add-ons to the OpenShift ecosystem. Builds, Jenkins, Tekton, CLIs, Templates, Samples, and RHTAP are some of the broader areas I have either lead or contributed to during my time at the company.


产品
工具
试用购买与出售
沟通
关于红帽
我们是世界领先的企业开源解决方案供应商,提供包括 Linux、云、容器和 Kubernetes。我们致力于提供经过安全强化的解决方案,从核心数据中心到网络边缘,让企业能够更轻松地跨平台和环境运营。