
In my first article, Part I: Like a Rainbow In The Dark, I described which problems distributed tracing can help you solve. I also provided some strategies for adopting this observability superpower without getting overwhelmed. As you continue down that path, though, there are some myths that need to be busted, and complex concepts demystified.
Let's start with a common phrase that sounds good at first but ultimately isn't useful. This statement can both come from the engineering trenches or whoever is calling the shots: “I want great observability without touching a line of code”.
That’s not going to happen. There are observability tools and agents that work without touching your code base, but without proper instrumentation, it’s not as effective as it could be. If you're afraid of the cost of instrumenting your code, remember that when you add an inoffensive debug log to your code, you're instrumenting it. Instrumenting code isn't something to be avoided, it's just something you need to do right.
Another common phrase is “With a mesh, I have tracing and that’s all the observability I need”.
A service mesh can be thought of as a no-code solution for everything. What you need to understand is how far it can carry you, and where you need to go after you've gotten started with it. Spoiler alert: in our next article, we'll explore different approaches and recommendations to instrument your code.
This is a mesh
A service mesh is a wonderful net to throw your microservices into. In the same way Kubernetes has those tedious lifecycle checks and mechanisms to restart your applications when they go down, the mesh helps you avoid implementing retries, load balancing, mTLS certificate management, and many more networking headaches.
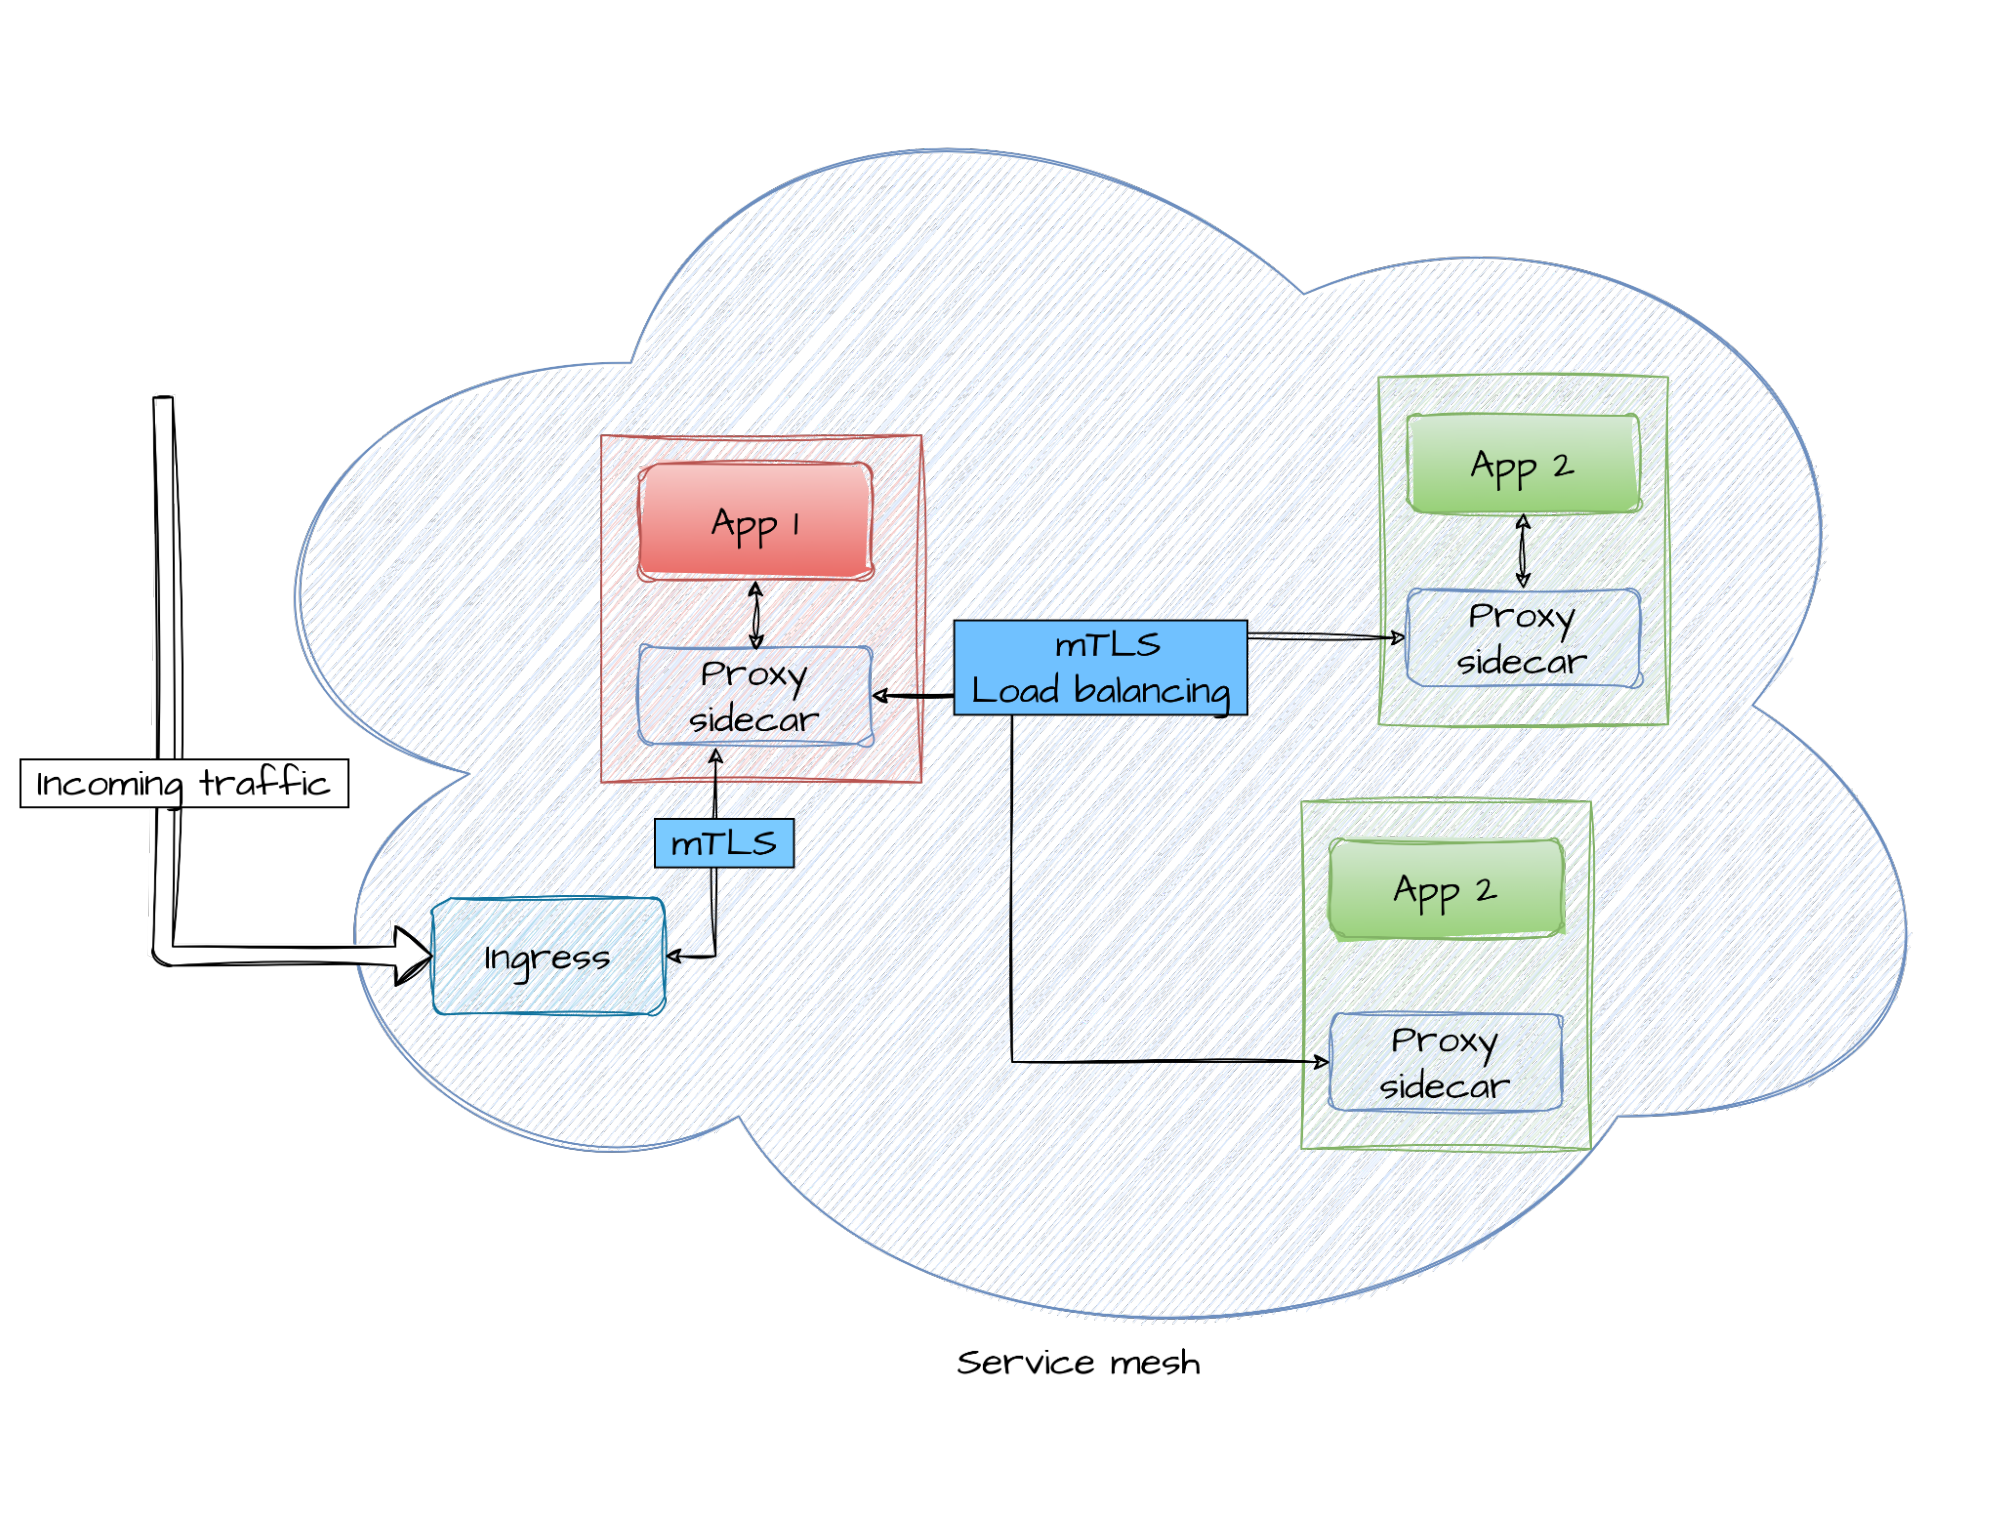
One good first approach is to think of a mesh as a set of networking service definitions, rules, and sidecars managed by a bunch of controllers. A service mesh can have many different implementations and can serve many use cases. Two examples:
- Load balancing: When you leverage the service mesh, there’s only one server to talk to at the other side (from an application’s point of view). There's just one connection to handle. The mesh can split that connection between many other services without you touching a line of code for your legacy application
- In-cluster mTLS communications: A mesh can make your developing life easier by absolving you of tasks you'd normally have to code manually. You only need to implement services that talk in plain HTTP to the mesh, which is the component doing all the real networking work (including certificate management)
This can be pretty convenient when you don’t want to implement the same thing over and over again in all your microservices.
Luckily from an end-user perspective, using a service mesh can be as simple as annotating your workloads (literally adding one line to their definition). When these workloads are scheduled for installation, the service mesh detects them and injects a sidecar into them. This sidecar gets in the middle of every communication you want and handles a lot of little details for you.
How can a service mesh help with observability?
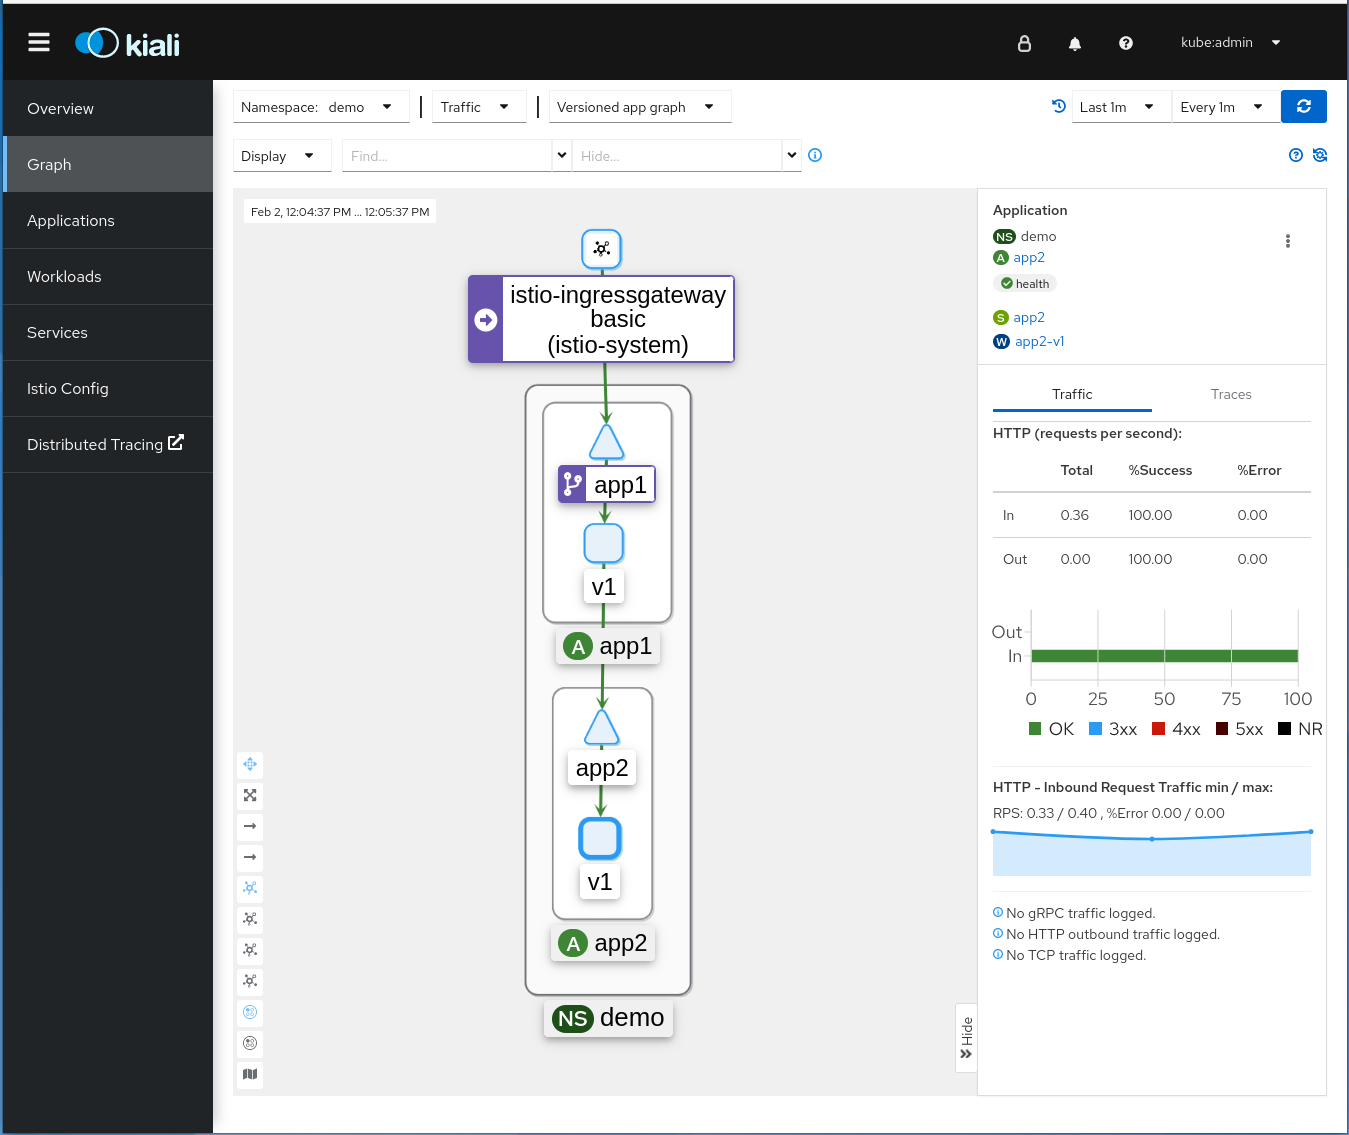
A mesh has the capability to intervene in an internal network, and to apply configurations from a central location. This is powerful, but it can also become very complex. The Kiali project provides a console to manage Istio, one of the most common service mesh implementations.
It didn’t take long for users to realize that observability is crucial to understand the mesh, so Kiala has invested a lot in providing an observability platform for Kiala and OpenShift consoles. Providing seamless integrations with common open source components is a great step towards a real democratization of this technology, which can otherwise be both complex and expensive.
A pillar of observability is distributed tracing, and conveniently Istio is instrumented with distributed tracing so it's possible to observe the service mesh itself!
Connecting the dots
It's crucial for you to be able to observe all your networking, as well as your applications inside the network. With the tools described so far, you've already got a lot of information, with useful and fancy service maps, success rates, and SLOs. But now it's time to understand what Istio does, and what you need to do to be able to observe your applications.
As I explained in my previous article, the main component of distributed tracing is context propagation both between services and inside an application. That's the secret that enables you to track all the paths traveled by your requests into the application. The propagation mechanism for HTTP is defined in the W3C TraceContext specification in the form of standardized headers.
Because Istio injects a sidecar in your workloads running on the service mesh, it's able to intercept all communications going through it. This provides the ability to handle distributed tracing context propagation:
- Is there a trace-id? Search for standardized distributed tracing headers
- Propagate the header if present, or create a new one
- Create its own span pertaining to this trace, so you can easily identify this transaction in the larger scheme of things

Yes, the service mesh does the tracing for you! Except there’s still a missing piece in this puzzle: If you don’t touch your code, then your application isn't propagating the context.
Consider the example we used in the first picture to describe the mesh:
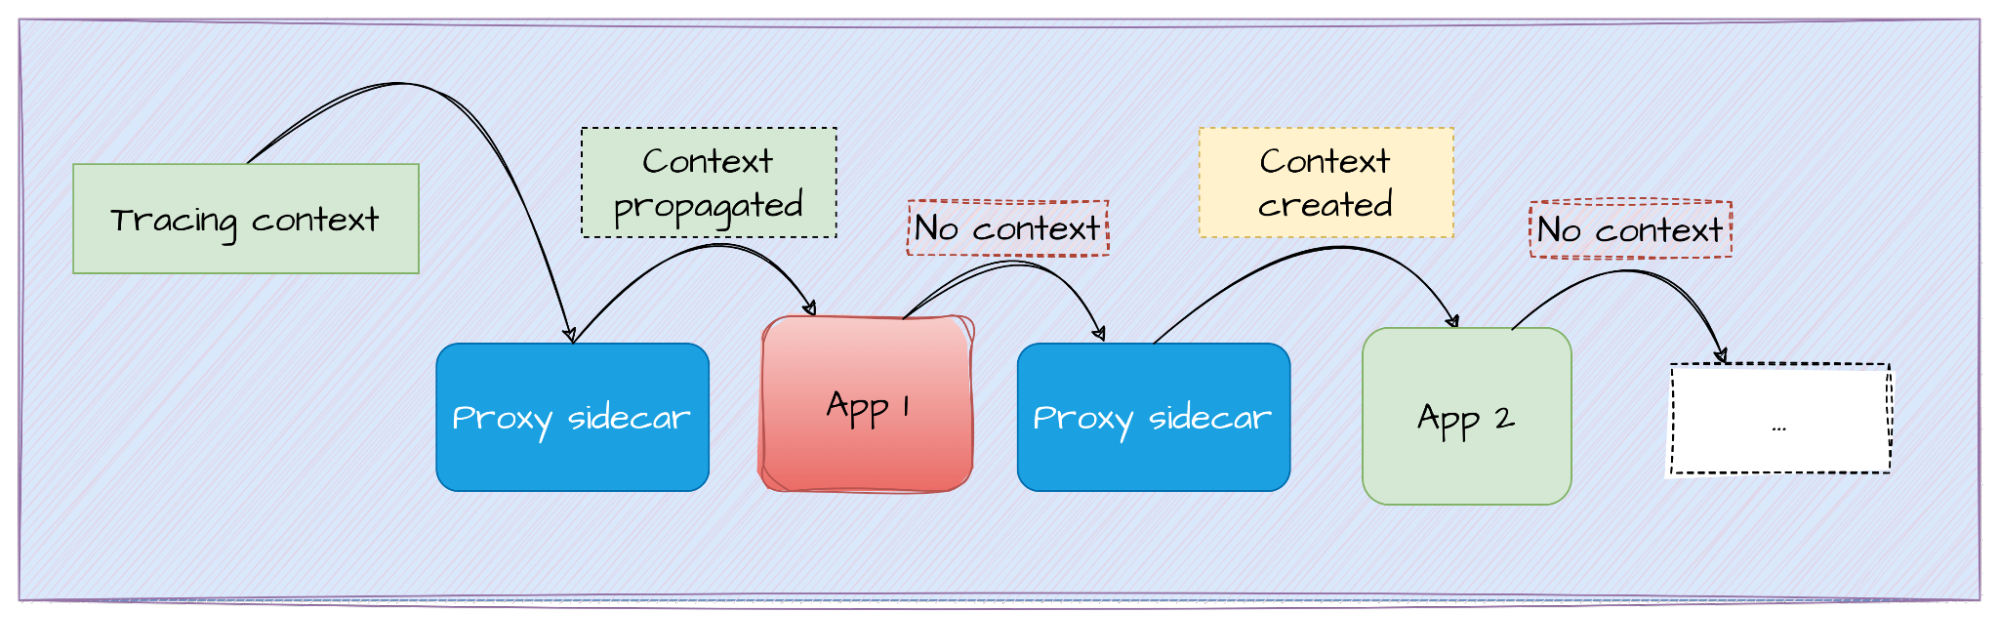
- The sidecar of App 1 may receive (or not) a standardized tracing context. Upon reception, this proxy sidecar creates a span and attaches it to the existing trace-id. If a tracing context is not received, a new one is created. This context is sent to the next in line: The actual App 1
- App 1 receives the message, processes it, and sends a request to App 2. Because we didn’t instrument App 1, no tracing headers were sent
- App 2 proxy sidecar does not detect a trace-id. It creates a span, believing it to be the first span because there's been no context. This new trace is sent to the next application, and so on
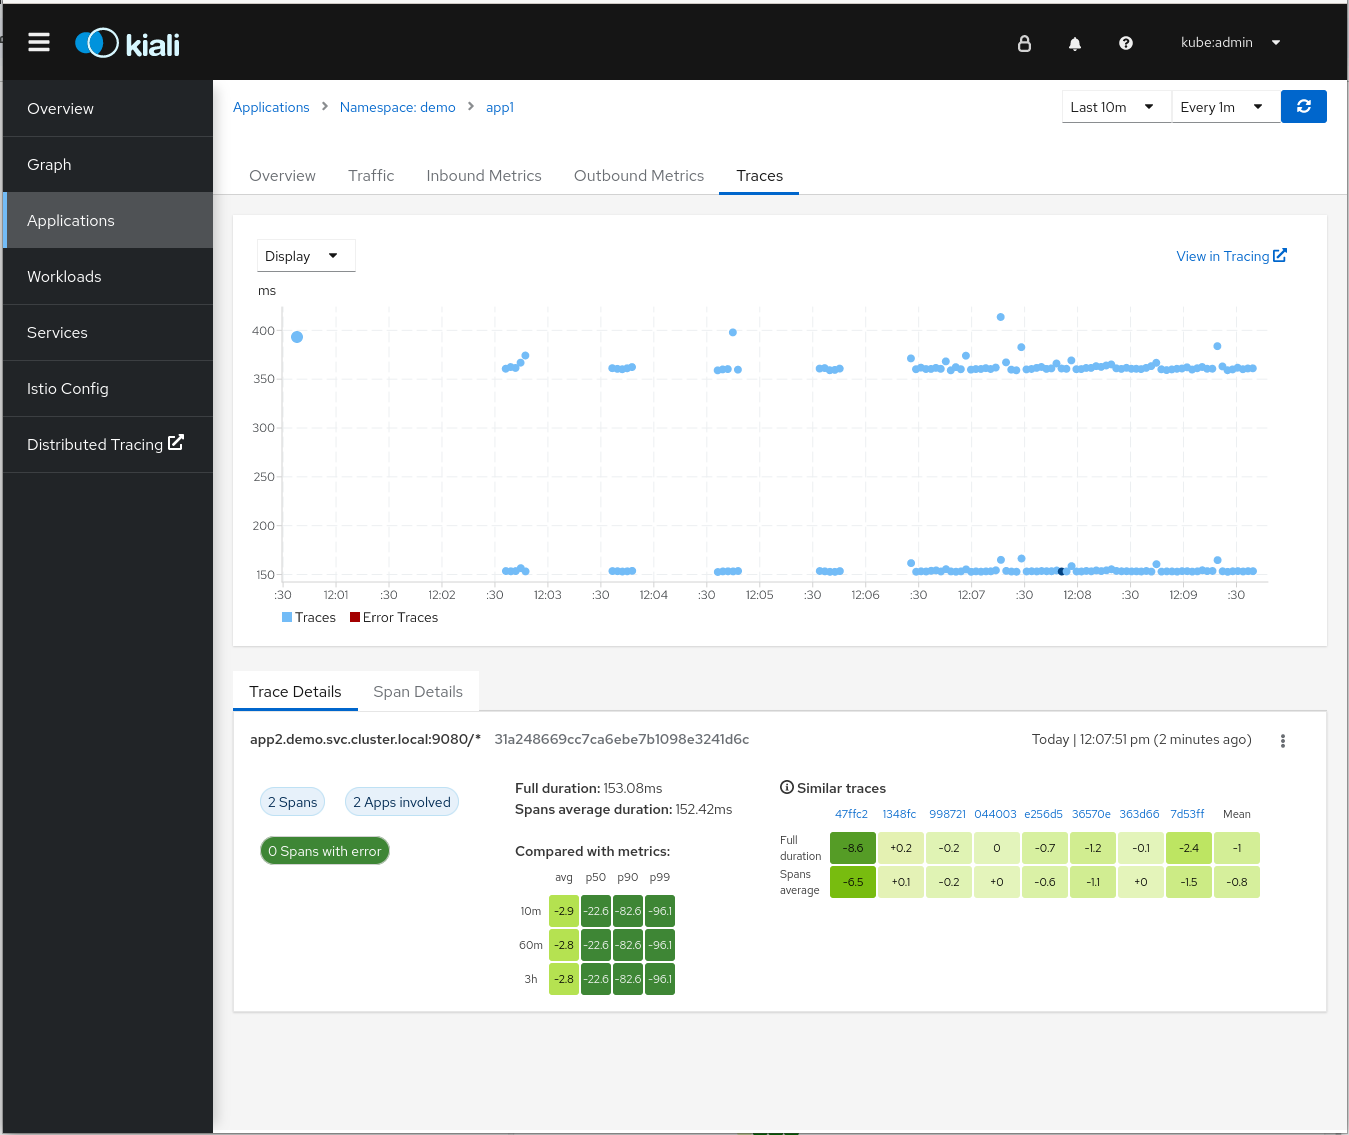
When all these spans are sent to the backend, they're not connected, so they're visualized as separate transactions instead of a single one divided into several steps.
To unleash the true value of distributed tracing, this problem needs to be resolved.
The service mesh is able to propagate or even create some traces and spans but without propagating the context, the story is still disconnected. This is why the “Traces view in Kiali” graph in the screenshot above is not very useful: There are two different sets of dots (nearly forming a solid line) when there should only be one. The ones at the top correspond to App 1, and the bottom ones to App 2. If you were propagating context, only one set of traces would have been shown.
But this still adds a lot of value. By leveraging the first steps in the service mesh, you can:
- Easily deploy and configure a minimal observability stack
- Generate useful spans
- Have a view of the service mesh topology
- Generate metrics for the traffic traveling between our services
Very useful tutorials can be found in the official Kiali docs.
Key takeaways
In the next article, we'll stop with the theory and demonstrate just how easy it can be to propagate the context! For now, here are four key takeaways about the service mesh and observability:
- There are great solutions to get started in modern observability.
- One of those approaches is to enable instrumentation in the service mesh.
- Propagating the context is critical to have a full understanding of a transaction.
- Kiali is a useful tool that helps you to manage and observe a service mesh and applications deployed into it, integrating perfectly with any modern observability stack.
关于作者

Jose is a Senior Product Manager at Red Hat OpenShift, with a focus on Observability and Sustainability. His work is deeply related to manage the OpenTelemetry, distributed tracing and power monitoring products in Red Hat OpenShift.
His expertise has been built from previous gigs as a Software Architect, Tech Lead and Product Owner in the telecommunications industry, all the way from the software programming trenches where agile ways of working, a sound CI platform, best testing practices with observability at the center have presented themselves as the main principles that drive every modern successful project.
With a heavy scientific background on physics and a PhD in Computational Materials Engineering, curiousity, openness and a pragmatic view are always expected. Beyond the boardroom, he is a C++ enthusiast and a creative force, contributing symphonic and electronic touches as a keyboardist in metal bands, when he is not playing videogames or lowering lap times at his simracing cockpit.

Israel is a Sofware Engineer at Red Hat OpenShift, with a focus on Observability, mainly on OpenTelemetry.
更多此类内容


产品
工具
试用购买与出售
沟通
关于红帽
我们是世界领先的企业开源解决方案供应商,提供包括 Linux、云、容器和 Kubernetes。我们致力于提供经过安全强化的解决方案,从核心数据中心到网络边缘,让企业能够更轻松地跨平台和环境运营。