If your PostgresSQL database is running slowly, you might be wondering how you can tune your Red Hat Enterprise Linux server for a PostgreSQL database workload. In this post, I’ll walk you through how a customer tuned PostgreSQL for Red Hat Enterprise Linux (RHEL).
First, let me give you the scenario: A physical server which has 160 logical CPUs and 3TB RAM (yes, you read that right) was having difficulty handling a load of 1,200+ running applications, all of which used PostgreSQL 9.6 as a database.
All those applications run on a very big Red Hat OpenShift cluster, and in some situations the active connections scaled up to the maximum configured in PostgreSQL, making applications unable to access the database. When applications start to crash, a chain reaction occurs, caused by the OpenShift Liveness and Readiness probes, which worsens the problem.
Sometimes things are not obvious, and we have no option but to delve into the problem and get our hands dirty.
PostgreSQL Setup
The customer PostgreSQL service acts in an ACTIVE-STANDBY setup.

Figure 1: PostgreSQL Active / Standby
The following PostgreSQL parameters are in use:
-
max_connections = 7000
-
shared_buffers = 750GB
-
effective_cache_size = 1434GB
-
work_mem = 192MB
-
max_worker_processes = 80
-
autovacuum_analyze_threshold = 50
-
autovacuum_vacuum_scale_factor = 0.1
-
autovacuum_vacuum_threshold = 30000
-
autovacuum_work_mem = 2GB
-
autovacuum_vacuum_cost_delay = 1ms
-
statement_timeout = 10800000
-
checkpoint_timeout = 15min
-
effective_io_concurrency = 200
The customer provided us with the following SELECT:

Figure 2: PostgreSQL Console Select
Connection Problems
During operation and for no obvious reasons, the applications started to crash due to INSERT DATABASE errors.
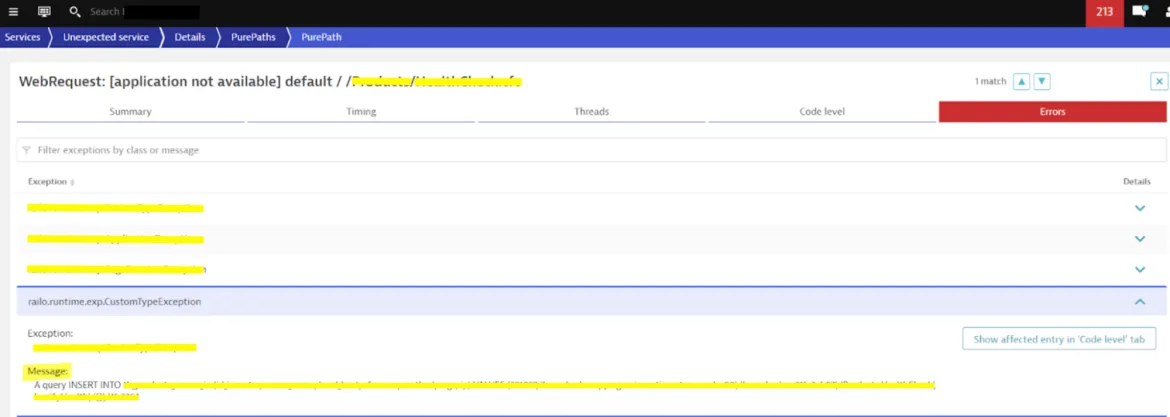
Figure 3: DynaTrace Captured Application Error
The monitoring also cannot collect database data, leaving blank areas on the graphics.
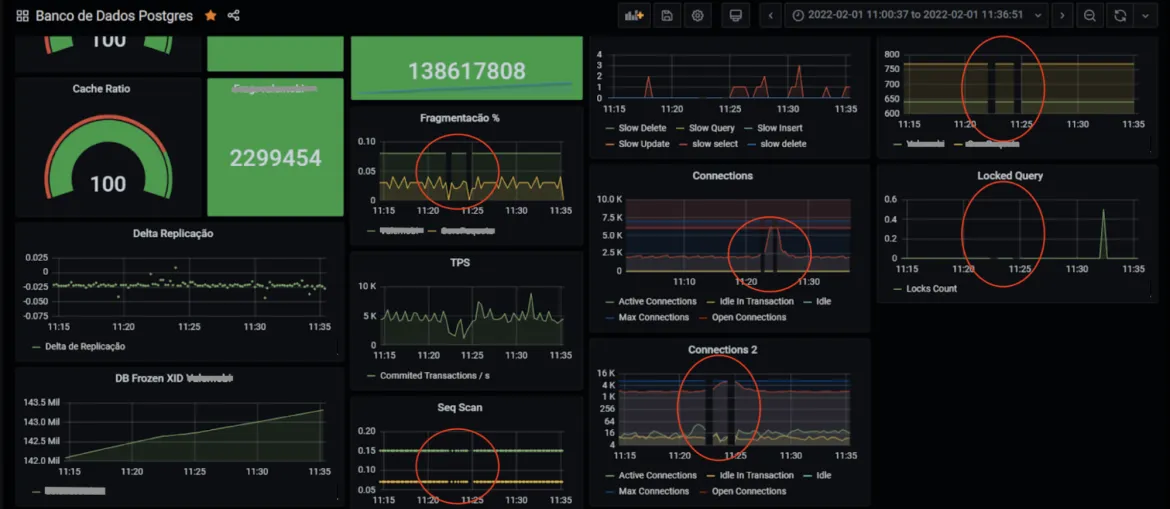
Figure 4: Graphics with blank spaces
For a production environment, the unavailable timeframe was unacceptable.
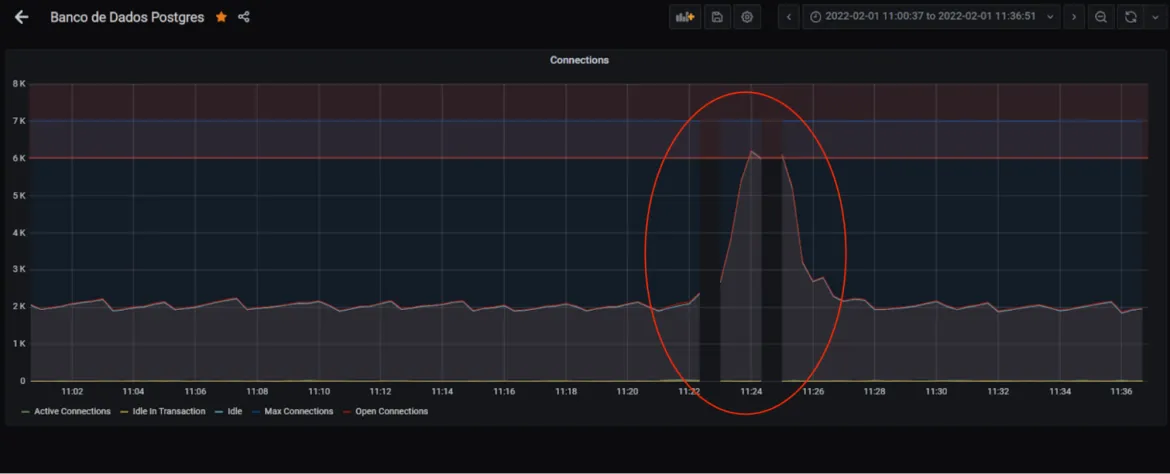
Figure 5: Graph showing database unavailable for several periods of time
Detective Work
After analysis of the PostgreSQL configuration file, it became clear the problem could be elsewhere, as the setup seemed fine.
There were no bottlenecks on the storage side, neither CPU or Network side. So we fired our weapons on the Operational System side. After some digging on RHEL, we discovered that the OS wasn't configured to handle the amount of requests imposed by the running applications, as we found out several attention points that should be addressed.
To solve the situation, we created a custom Tuned Profile specially designed with the hardware resources available in mind, as well customized limits of the OS.
PostgreSQL Tuned Profile
The first step was to enable the systemd-sysctl service, as customer used some custom SYSCTL parameters (/etc/sysctl.conf), and we didn't want to mix those with our Tuned profile:
# systemctl is-active systemd-sysctl.service
# systemctl enable --now systemd-sysctl.service
As we have an unusual amount of hardware resources in the environment, we created a custom tuned profile especially designed, so that PostgreSQL could consume the resources in the best possible way.
# mkdir /usr/lib/tuned/postgresql
Create the profile definitions:
printf "
[main]
summary=Optimize for PostgreSQL RDBMS
include=throughput-performance
[sysctl]
vm.swappiness = 10
vm.dirty_background_ratio = 10
vm.dirty_ratio = 40
vm.dirty_expire_centisecs = 3000
vm.dirty_writeback_centisecs = 500
kernel.shmmax = 18446744073692700000
kernel.shmall = 18446744073692700000
kernel.shmmni = 4096
kernel.sem = 250 512000 100 2048
fs.file-max = 312139770
fs.aio-max-nr = 1048576
net.ipv4.ip_local_port_range = 2048 65499
# Permits sockets in the time-wait state to be reused for new connections:
net.ipv4.tcp_tw_reuse = 1
net.core.netdev_budget = 1024
net.core.netdev_max_backlog = 2048
net.core.rmem_default = 262144
net.core.rmem_max = 4194304
net.core.wmem_default = 262144
net.core.wmem_max = 1048576
kernel.panic_on_oops = 1
# We don't need NUMA balancing in this box:
kernel.numa_balancing = 0
# Used if not defined by the service:
net.core.somaxconn = 4096
# Other parameters to override throughput-performance template
net.ipv4.tcp_rmem = 4096 87380 16777216
net.ipv4.tcp_wmem = 4096 65536 16777216
net.ipv4.tcp_window_scaling = 1
net.netfilter.nf_conntrack_max = 250000
net.ipv4.tcp_max_syn_backlog=4096
[vm]
transparent_hugepages=never
" > /usr/lib/tuned/postgresql/tuned.conf
To know more about kernel tuning parameters, this Kernel.org resource might be helpful. There is more information in the documentation for /proc/sys/vm/ too.
Apply proper SELinux labels to the file:
# restorecon -RFvv /usr/lib/tuned/postgresql
Check if the profile is listed along with the others:
[root@pgsql-lab ~]# tuned-adm list | grep postgre
- postgresql                  - Optimize for PostgreSQL RDBMS
If everything is OK, activate the "postgresql" profile using Tuned:
# tuned-adm profile postgresql
Check if it was loaded:
# tuned-adm active
Current active profile: postgresql
TIP: On the first attempt, tuned was unable to load the profile. After a few seconds, a DBus timeout error occurred. A reboot solved this problem.
Operational System Limits
A very loaded system uses a lot of sockets and processes. This needs opened files and customized limits other than default ones:
printf "
* soft nofile 500000
* hard nofile 500000
root soft nofile 500000
root hard nofile 500000
postgres soft nofile 500000
postgres hard nofile 500000
" > /etc/security/limits.d/30-pgsqlproc.conf
Yes I know. Things are a little over the top here, but that was exactly the point. You don't need the lines started by the "*", but this was a customer request.
Apply proper SELinux labels to the file:
# restorecon -Fvv /etc/security/limits.d/30-pgsqlproc.conf
Mount Point Tuning
The "noatime" FSTAB mount point option can save some I/O operations. For a heavy loaded system, this setup will do a significant improve on disk access times.
/dev/mapper/pgsql-pgsql /database xfs defaults,noatime 1 2
RX Ring Buffer Tuning
We've spotted very little RX drop rate, but we wanted things running as smooth as possible. On the environment, NICs was configured using "ifcfg-*" files. So for every connection with a drop rate other than zero, we've added the following statement:
ETHTOOL_OPTS="-G ens192 rx 4096 tx 4096"
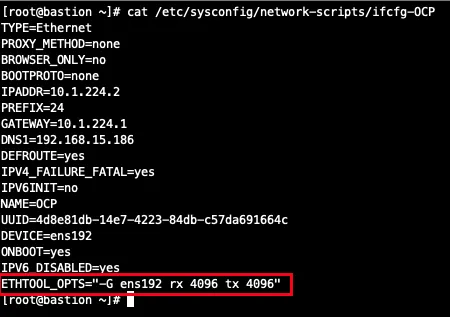
Figure 6: Ring Buffer Tuning Example
To change the setup on the fly:
# ethtool -G eno3 rx 4096 tx 4096
# ethtool -G eno4 rx 4096 tx 4096
# ethtool -G ens6f0 rx 4096 tx 4096
# ethtool -G ens6f1 rx 4096 tx 4096
You can also make it permanent by editing by using NMCLI. As for an example:
# nmcli connection modify LAN ethtool.ring-rx 4096 ethtool.ring-tx 4096
# nmcli connection up LAN
PostgreSQL unit file
Copy the PostgreSQL original unit file to /etc/systemd/system .
# cp /usr/lib/systemd/system/postgresql-9.6.service /etc/systemd/system/
On the service section, add the following parameters:
# vi /etc/systemd/system/postgresql-9.6.service
(...)
[Service]
Type=notify
User=postgres
Group=postgres
LimitAS=infinity
LimitRSS=infinity
LimitCORE=infinity
LimitNOFILE=500000
LimitNOPROC=500000
And do a systemd reload to inform the changes to the OS:
# systemctl daemon-reload
Checking the Settings
Before going any further, stop the database and reboot the system. After that check the following items:
-
Mount Points
# mount
-
Active Tuned Profile
# tuned-adm active
-
Other SYSCTL settings
# sysctl -a
-
Network RX Settings
# ifconfig -a
Start PostgreSQL
Now it's time to validate our settings. Start the PostgreSQL service:
# systemctl start postgresql-9.6.service
# systemctl status postgresql-9.6.service
Get some child process PIDs:
# ps faxuw | grep postgre | grep -v ^root

postgres  1276  0.2  0.3 362684 15540 ?        Ss   12:40   0:00 /usr/pgsql-9.6/bin/postmaster -D /var/lib/pgsql/9.6/data/
postgres  1278  0.0  0.0 217680  1568 ?        Ss   12:40   0:00  \_ postgres: logger process
postgres  1280  0.0  0.0 362684  1692 ?        Ss   12:40   0:00  \_ postgres: checkpointer process
postgres  1281  0.0  0.0 362684  1932 ?        Ss   12:40   0:00  \_ postgres: writer process
postgres  1282  0.0  0.0 362684  1692 ?        Ss   12:40   0:00  \_ postgres: wal writer process
postgres  1283  0.0  0.0 363096  2808 ?        Ss   12:40   0:00  \_ postgres: autovacuum launcher process
postgres  1284  0.0  0.0 217676  1808 ?        Ss   12:40   0:00  \_ postgres: stats collector process
Checking PostgreSQL New Limits
In the "/proc" directory, read the contents of the "limits" file for the selected PID.
# cat /proc/1276/limits
Limit                     Soft Limit           Hard Limit           Units
(...)
Max processes             500000               500000               processes
Max open files            500000               500000               files
(...)
You should see that the Soft and Hard limits were inherited from our tuning.
To check listen backlog run (Send-Q column represent listen backlog), use the command below:
# ss -peaonmi | egrep "LISTEN.*:5432|Send"
Checking the Environment
After all these adjustments, the environment was put into production. After a few days of operation, no database connection problems were detected. All usage graphs are now complete and have no read failures.
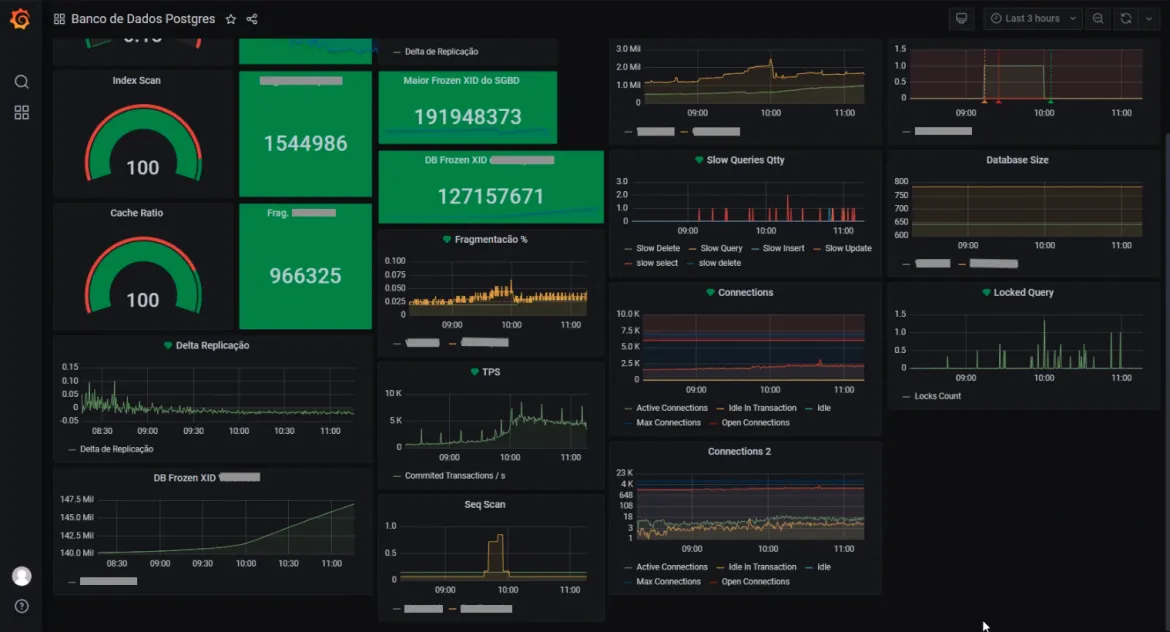
Figure 7: Graphics after Tuning
At the time of this writing, two weeks have passed since the OS tweaks, and no problems were detected.
So far, the environment is stable and there were no more problems connecting to the database.
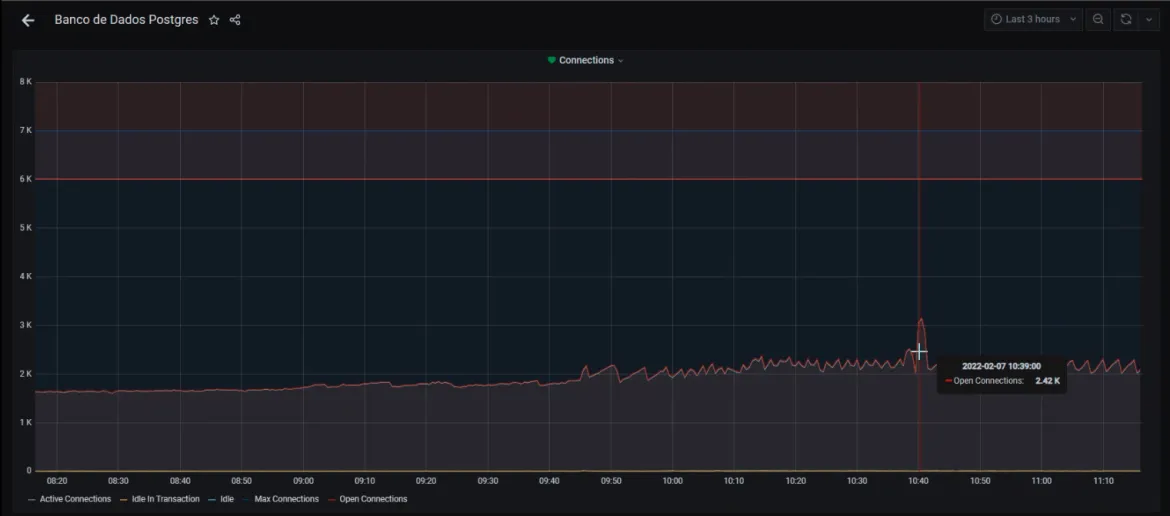
Figure 8: PostgreSQL Connections after Tuning
You can use netstat to collect data and see if you need to adjust something else. As for an example:
# netstat -st

IcmpMsg:
InType0: 52
InType3: 1309
InType8: 863125
InType11: 73
InType13: 1
InType17: 3
OutType0: 862684
OutType3: 1139550
OutType8: 104
OutType14: 1
Tcp:
764596 active connections openings
133942412 passive connection openings
17489 failed connection attempts
1599 connection resets received
2674 connections established
9519097400 segments received
33519701725 segments send out
233767 segments retransmited
13 bad segments received.
35059 resets sent
UdpLite:
TcpExt:
1078 invalid SYN cookies received
734296 TCP sockets finished time wait in fast timer
1337 packets rejects in established connections because of timestamp
19398483 delayed acks sent
13777 delayed acks further delayed because of locked socket
Quick ack mode was activated 422119 times
2858612 packets directly queued to recvmsg prequeue.
21873381 bytes directly in process context from backlog
370684112 bytes directly received in process context from prequeue
2507985783 packet headers predicted
227715 packets header predicted and directly queued to user
2133228303 acknowledgments not containing data payload received
3119266417 predicted acknowledgments
27303 times recovered from packet loss by selective acknowledgements
Detected reordering 18 times using FACK
Detected reordering 232 times using SACK
Detected reordering 64 times using time stamp
3908 congestion windows fully recovered without slow start
4564 congestion windows partially recovered using Hoe heuristic
7510 congestion windows recovered without slow start by DSACK
2816 congestion windows recovered without slow start after partial ack
TCPLostRetransmit: 143
337 timeouts after SACK recovery
29 timeouts in loss state
97997 fast retransmits
18907 forward retransmits
479 retransmits in slow start
27359 other TCP timeouts
TCPLossProbes: 383809
TCPLossProbeRecovery: 33889
60 SACK retransmits failed
422242 DSACKs sent for old packets
1 DSACKs sent for out of order packets
83360 DSACKs received
12 DSACKs for out of order packets received
3934 connections reset due to unexpected data
61 connections reset due to early user close
8025 connections aborted due to timeout
TCPDSACKIgnoredOld: 166
TCPDSACKIgnoredNoUndo: 31455
TCPSpuriousRTOs: 281
TCPSackShifted: 330642
TCPSackMerged: 89398
TCPSackShiftFallback: 139039755
IPReversePathFilter: 15098
TCPRetransFail: 1287
TCPRcvCoalesce: 44410647
TCPOFOQueue: 846399
TCPOFOMerge: 1
TCPChallengeACK: 22
TCPSYNChallenge: 22
TCPSpuriousRtxHostQueues: 1280
TCPAutoCorking: 116581684
TCPFromZeroWindowAdv: 157754
TCPToZeroWindowAdv: 157754
TCPWantZeroWindowAdv: 143204
TCPSynRetrans: 63215
TCPOrigDataSent: 32308875983
TCPHystartTrainDetect: 1042105
TCPHystartTrainCwnd: 19310435
TCPHystartDelayDetect: 44
TCPHystartDelayCwnd: 901
TCPACKSkippedPAWS: 950
TCPACKSkippedSeq: 314752
IpExt:
InMcastPkts: 12
InBcastPkts: 14991623
InOctets: 12066155420266
OutOctets: 51102612485093
InMcastOctets: 384
InBcastOctets: 1218486604
InNoECTPkts: 11106956887
InECT0Pkts: 9165
Conclusion
In this post, we talked you through how a customer tuned PostgreSQL for Red Hat Enterprise Linux (RHEL).
Want to learn more about performancing tuning on RHEL? Check out our “Red Hat Performance Tuning: Linux in Physical, Virtual, and Cloud” and “Red Hat Certified Specialist in Performance Tuning” courses to get the skills you need to tune network performance on Red Hat Enterprise Linux.
关于作者
Andre Rocha is a Consultant at Red Hat focused on OpenStack, OpenShift, RHEL and other Red Hat products. He has been at Red Hat since 2019, previously working as DevOps and SysAdmin for private companies.
产品
工具
试用购买与出售
沟通
关于红帽
我们是世界领先的企业开源解决方案供应商,提供包括 Linux、云、容器和 Kubernetes。我们致力于提供经过安全强化的解决方案,从核心数据中心到网络边缘,让企业能够更轻松地跨平台和环境运营。

