
Toward self-healing automation
In this article we'll explore how to automate the handling of system performance degradation.
Detecting and responding to performance problems is an important part of system administration. Tools are available as part of Red Hat Enterprise Linux (RHEL) and Red Hat Ansible Automation Platform to address each step of this process.
Performance metrics inference engine (PMIE)
The suite of analysis tools forming the Performance Co-Pilot (PCP) in RHEL includes pmie(1), a service for performance rule evaluation. Expressing rules relating to performance presents a unique challenge for administrators in that they often require complex expressions over time series data.
The PCP inference engine is uniquely positioned to solve this problem—it efficiently samples metrics in real-time on-host and provides a powerful predicate language for expressing any problematic performance scenario. For example, default rules include those that detect excessive swap activity under memory pressure, or detect high average processor utilization. Existing performance rules on a system can be listed using the pmieconf(1) rules command, demonstrated later in this post.
Event-Driven Ansible
Event-Driven Ansible is a new Ansible Automation Platform feature where Ansible Playbooks can be run in response to events that happen in your environment. Even performance events? Sure! Let's take a closer look into making these two technologies work together.
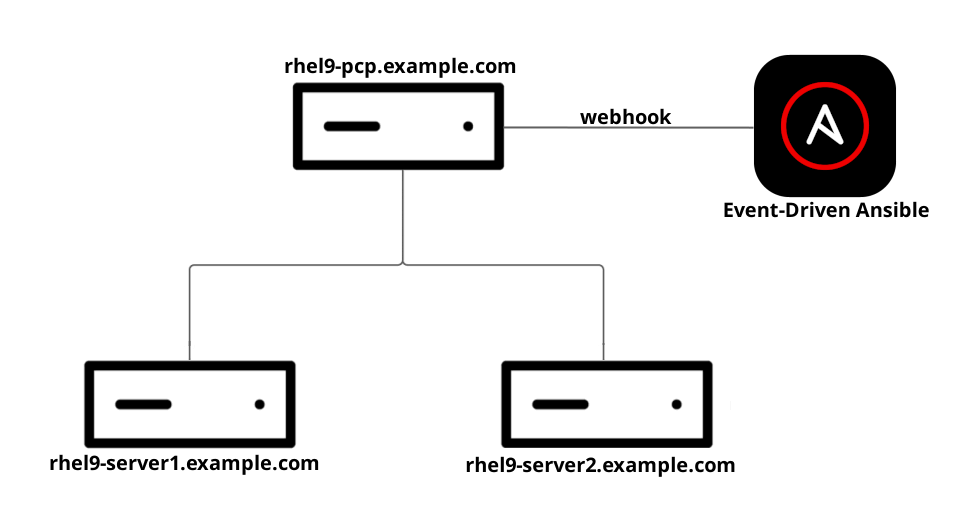
By the end of the example covered in this blog, we’ll have PCP and Event-Driven Ansible configured so that when there is a "High average processor utilization" pmie event in the environment, a webhook will trigger Event-Driven Ansible to run an Ansible Automation Platform template or playbook on the host that had the CPU event.
In the demo environment there are several systems:
- rhel9-pcp.example.com: a RHEL 9.3 system that will act as the central PCP management site
- rhel9-server1.example.com: RHEL 9.3 client system
- rhel9-server2.example.com: RHEL 9.3 client system
- aap.example.com: Ansible Automation Platform Automation controller system
- eda.example.com: Ansible Automation Platform Event-Driven Ansible controller system
In this example, there are two RHEL 9.3 client systems, however in a real world deployment there could be many more. Rather than having each of these client systems directly send webhook events to the Event-Driven Ansible controller, we will use the rhel9-pcp.example.com system as a PCP management site system. This central system is where the pmie rules for each client system will be evaluated, and if a pmie rule evaluates to true, a webhook will be sent from this central system to the Event-Driven Ansible controller.
PCP introduced the ability to send webhook actions in RHEL 9.3, so you’ll need to be using pcp-6.0.5-4 or later. You can confirm if your version of PCP supports webhook actions with the following command:
test -f /etc/pcp/pmieconf/testing/test_actions || echo "We need pcp-6.0.5-4 or later"
Configuring PCP on RHEL systems
We’ll start by configuring PCP on the RHEL systems. We’ll use the metrics RHEL system role to perform most of the configuration. For more information on the metrics system role, see Automate performance metrics collection and visualization with RHEL System Roles.
We have a RHEL inventory defined in the Ansible Automation Platform environment which lists the three RHEL 9.3 systems (rhel9-pcp.example.com, rhel9-server1.example.com, and rhel9-server2.example.com). An inventory group named servers includes the rhel9-server1.example.com and rhel9-server2.example.com systems, and an inventory group named metrics_monitor includes the rhel9-pcp.example.com system.
In the inventory we defined these metrics system role variables for the servers group:
---
metrics_retention_days: 7
metrics_manage_firewall: true
These variables will configure rhel9-server1.example.com and rhel9-server2.example.com to record metrics and retain them for 7 days, and will configure the firewall.
And we defined these metrics system role variables for the metrics_monitor group:
---
metrics_manage_firewall: true
metrics_retention_days: 7
metrics_monitored_hosts:  "{{ groups['servers'] }}"
webhook_endpoint: "http://192.168.122.107:5000/endpoint"
These variables will configure rhel9-pcp.example.com to be the central PCP management site system for rhel9-server1.example.com and rhel9-server2.example.com systems, metrics will be retained for 7 days, and the firewall will be configured. In addition, we defined a variable with the URL of the Event-Driven Ansible webhook endpoint that PCP should send webhooks to.
Next, we will define a template in Ansible Automation Platform which will run the following playbook:
- name: Use metrics system role to configure PCP metrics recording
  hosts: servers
  roles:
    - redhat.rhel_system_roles.metrics

- name: Use metrics system role to configure metrics_monitor system
  hosts: metrics_monitor
  roles:
    - redhat.rhel_system_roles.metrics

- name: Enable PMIE configuration for webhooks
  hosts: metrics_monitor
  vars:
    default_config:
      - "default"
    server_list: "{{ groups['servers'] + default_config }}"
  tasks:
    - name: Check if global webhook_action is configured
      lineinfile:
        state: absent
        path: /var/lib/pcp/config/pmie/config.{{ item }}
        regexp: "//.*global webhook_action = yes"
      check_mode: true
      changed_when: false
      register: global_webhook_action_status
      loop: "{{ server_list }}"

    - name: Configure global webhook_action
      command: "pmieconf -f /var/lib/pcp/config/pmie/config.{{ item.item }} modify global webhook_action yes"
      loop: "{{ global_webhook_action_status.results }}"
      when: item.found == 0
      notify: Restart pmie

    - name: Check if global webhook_endpoint is configured
      lineinfile:
        state: absent
        path: /var/lib/pcp/config/pmie/config.{{ item }}
        regexp: "//.*global webhook_endpoint = \"{{ webhook_endpoint }}\""
      check_mode: true
      changed_when: false
      register: global_webhook_endpoint_status
      loop: "{{ server_list }}"

    - name: Configure global webhook_endpoint
      command: "pmieconf -f /var/lib/pcp/config/pmie/config.{{ item.item }} modify global webhook_endpoint {{ webhook_endpoint }}"
      loop: "{{ global_webhook_endpoint_status.results }}"
      when: item.found == 0
      notify: Restart pmie

  handlers:
    - name: Restart pmie
      service:
        name: pmie
        state: restarted
This playbook will run the metrics system role on the two inventory groups. It will then configure the global webhook_action and global webhook_endpoint pmie configuration options on the rhel9-pcp.example.com system for the 3 client systems that pmie will be monitoring (rhel9-pcp.example.com, rhel9-server1.example.com and rhel9-server2.example.com).
After running this template/playbook, we can confirm that PCP is properly set up on the rhel9-pcp.example.com system by running the pcp summary command:
[root@rhel9-pcp ~]# pcp summary
Performance Co-Pilot configuration on rhel9-pcp.example.com:

 platform: Linux rhel9-pcp.example.com 5.14.0-362.2.1.el9_3.x86_64 #1 SMP PREEMPT_DYNAMIC Fri Sep 8 04:21:26 EDT 2023 x86_64
 hardware: 2 cpus, 1 disk, 1 node, 3903MB RAM
 timezone: MDT+6
 services: pmcd
     pmcd: Version 6.0.5-4, 12 agents, 6 clients
     pmda: root pmcd proc pmproxy xfs linux nfsclient mmv kvm jbd2
           dm openmetrics
 pmlogger: primary logger: /var/log/pcp/pmlogger/rhel9-pcp.example.com/20231017.08.59-00
           rhel9-server1.example.com: /var/log/pcp/pmlogger/rhel9-server1.example.com/20231017.08.59-00
           rhel9-server2.example.com: /var/log/pcp/pmlogger/rhel9-server2.example.com/20231017.08.59-00
     pmie: primary engine: /var/log/pcp/pmie/rhel9-pcp.example.com/pmie.log
           rhel9-server1.example.com: /var/log/pcp/pmie/rhel9-server1.example.com/pmie.log
           rhel9-server2.example.com: /var/log/pcp/pmie/rhel9-server2.example.com/pmie.log
The last 3 lines show that pmie is configured to monitor the local system, as well as rhel9-server1.example.com and rhe9-server2.example.com.
Configuring the Event-Driven Ansible controller
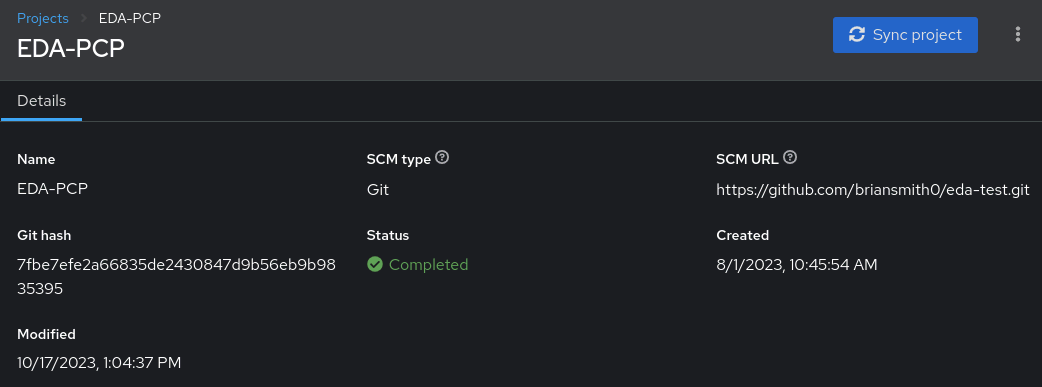
Next we’ll login to the Event-Driven Ansible controller system and create a new project, which in this example is pointed to this GitHub repository which includes this simple rulebook:
- name: Listen for RHEL Performance Co-Pilot events
  hosts: all
  sources:
    - ansible.eda.webhook:
        host: 0.0.0.0
        port: 5000
  rules:
    - name: Respond to PMIE rule for High average processor utilization
      condition: event.payload.pcp.pmie.rule == "High average processor utilization"
      action:
        run_job_template:
          name: eda-test
          organization: Default

    - name:  Display contents of event.payload variable
      condition: event.payload is defined
      action:
        debug:
          msg: "Received: {{ event.payload }}"
This rulebook is looking specifically for the "High average processor utilization" pmie rule, which is one of the default rules. When this rule is triggered, it will run the eda-test Ansible Automation Platform template. There is also a rule defined to display the event.payload variable contents, which can help with initial configuration and troubleshooting of the rulebook.
You can see the other available default pmie rules by running the pmieconf rules command from the rhel9-pcp.example.com system.
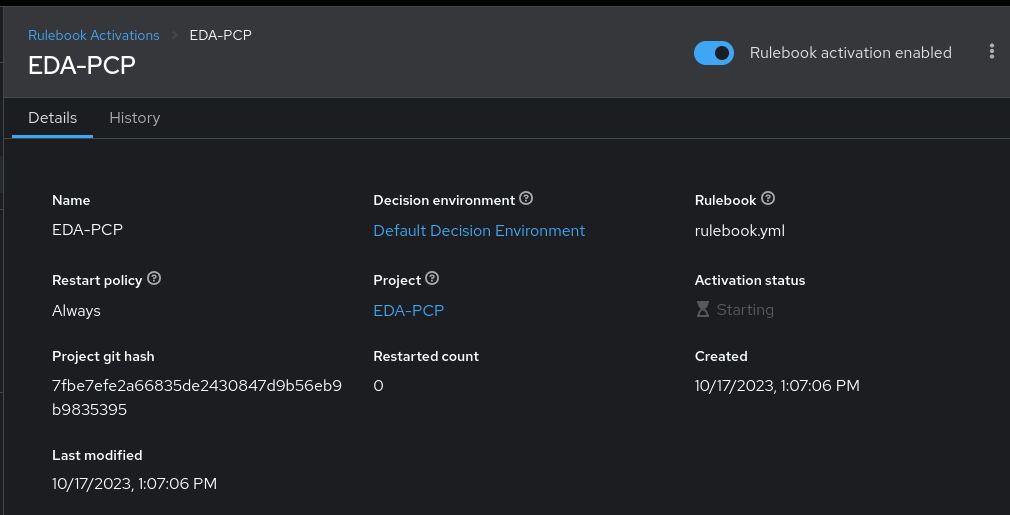
Still on the Event-Driven Ansible controller, the next step is to create a rulebook activation, utilizing the project that was just defined.
We’ll also open TCP port 5000 in the firewall on the Event-Driven Ansible controller system so that it is able to receive webhooks on this port.
Configuring the automation controller
The final step is to configure the eda-test template (that we referenced in the rulebook) on our automation controller. This is the template that will run when any of the three RHEL 9 systems have a "High average processor utilization" pmie event.
I’ll define the template that utilizes a project with the following playbook:
---
- name: EDA response to High average processor utilization event
  hosts: "{{ ansible_eda.event.payload.pcp.pmie.hostname }}"
  tasks:
    - name: Display ansible_eda.event.payload.pcp.pmie.message variable
      debug:
        msg: "ansible_eda.event.payload.pcp.pmie.message value:  {{ ansible_eda.event.payload.pcp.pmie.message }} "
    - name: Display ansible_eda.event.payload.pcp.pmie.hostname variable
      debug:
        msg: "ansible_eda.event.payload.pcp.pmie.hostname value:  {{ ansible_eda.event.payload.pcp.pmie.hostname }} "
    - name: Display ansible_eda.event.payload.pcp.pmie.rule variable
      debug:
        msg: "ansible_eda.event.payload.pcp.pmie.rule value:  {{ ansible_eda.event.payload.pcp.pmie.rule }} "
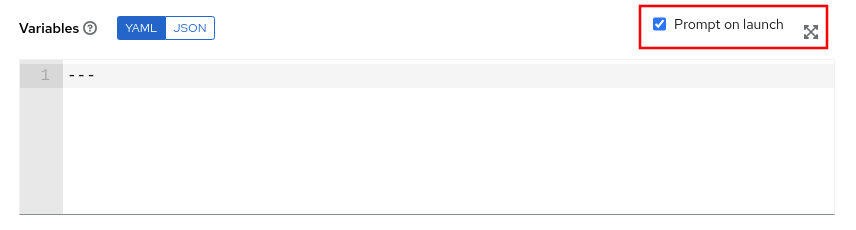
In the template, it is also important to select the Prompt on launch option for variables.
This example playbook simply displays the values of the various variables that will be passed to the playbook. In a real world scenario, this playbook could take corrective action to address the high processor utilization by restarting a process, spinning up additional systems to handle the load, creating a ticket to track the incident, etc.
Putting it all together and validating the configuration
At this point everything is configured. The rhel9-pcp.example.com system will be monitoring each of the three RHEL 9 systems (rhel9-pcp.example.com, rhel9-server1.example.com, and rhel9-server2.example.com). If pmie identifies that any of these have high average processor utilization, the rhel9-pcp.example.com system will send a webhook to the Event-Driven Ansible controller. This will trigger the eda-test template to run (note the hosts: line in the eda-test template playbook will limit the playbook to only run on the system that was the source of the CPU event).
To validate, on the rhel9-server2.example.com system, I’ll start several processes that will take 100% of the available CPU resources.
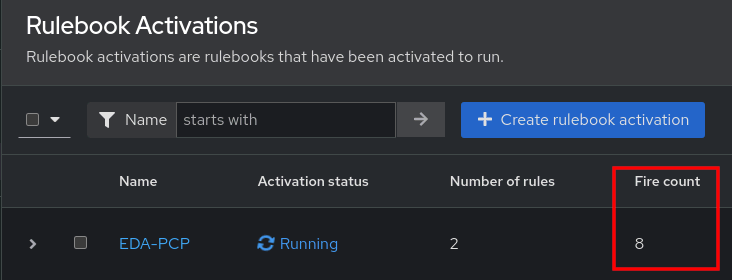
After a short time, from the Event-Driven Ansible controller, I can see that the EDA-PCP rulebook activation has incremented the fire count, indicating rules in the rulebook have been run.
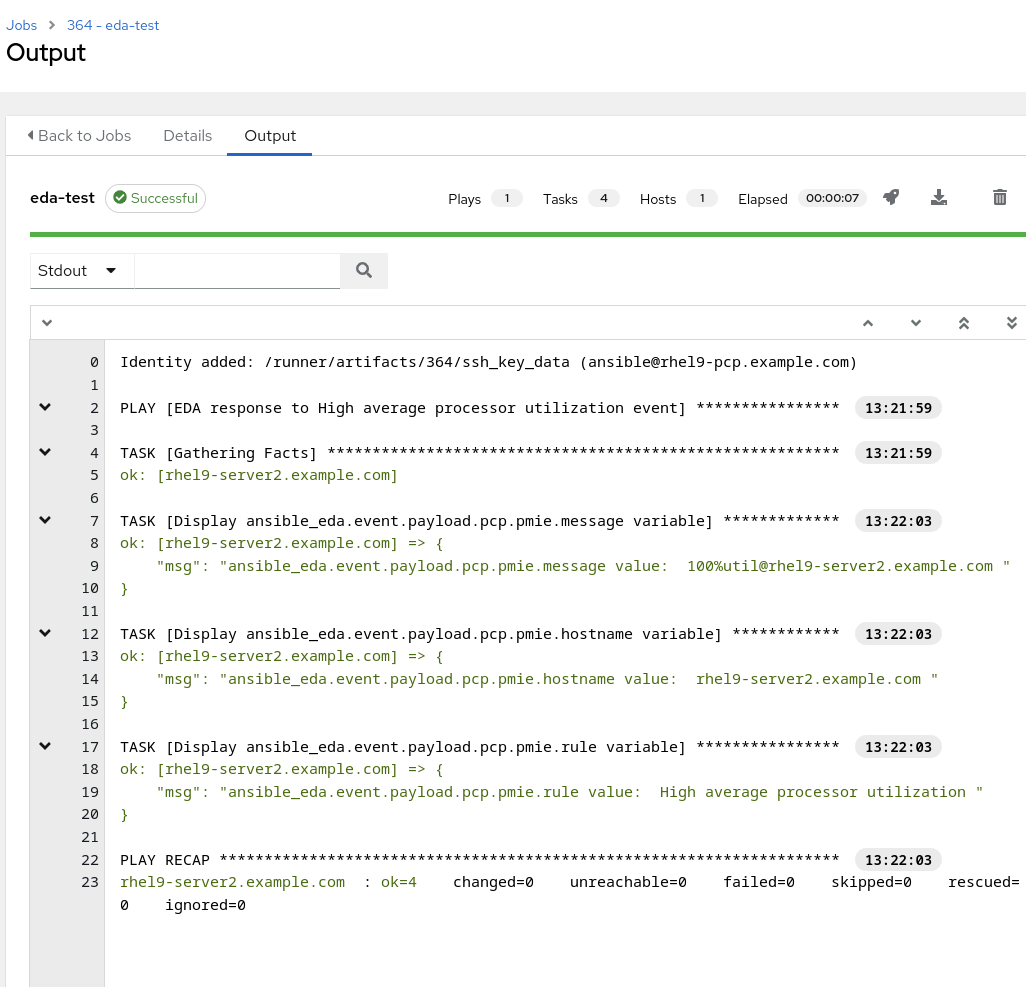
From the automation controller, I can see that the eda-test template was run on the the rhel9-server2.example.com system:
Summary
We've explored the techniques required to automatically respond to performance problems with Ansible Playbooks using Event-Driven Ansible. You have all the tools you need now to begin to build a customized solution for your own production environments—add new rules (via pmie), new responses (via EDA rulebooks) and quickly roll these out to monitor as many hosts as you need. Enjoy!
Über die Autoren

Nathan is an engineer in Red Hat's Platform Tools group, leading the Grafana and PCP team.

Brian Smith is a product manager at Red Hat focused on RHEL automation and management. He has been at Red Hat since 2018, previously working with public sector customers as a technical account manager (TAM).
Nach Thema durchsuchen

Automatisierung
Das Neueste zum Thema IT-Automatisierung für Technologien, Teams und Umgebungen

Künstliche Intelligenz
Erfahren Sie das Neueste von den Plattformen, die es Kunden ermöglichen, KI-Workloads beliebig auszuführen

Open Hybrid Cloud
Erfahren Sie, wie wir eine flexiblere Zukunft mit Hybrid Clouds schaffen.

Sicherheit
Erfahren Sie, wie wir Risiken in verschiedenen Umgebungen und Technologien reduzieren

Edge Computing
Erfahren Sie das Neueste von den Plattformen, die die Operations am Edge vereinfachen

Infrastruktur
Erfahren Sie das Neueste von der weltweit führenden Linux-Plattform für Unternehmen

Anwendungen
Entdecken Sie unsere Lösungen für komplexe Herausforderungen bei Anwendungen

Original Shows
Interessantes von den Experten, die die Technologien in Unternehmen mitgestalten
Produkte
- Red Hat Enterprise Linux
- Red Hat OpenShift
- Red Hat Ansible Automation Platform
- Cloud-Services
- Alle Produkte anzeigen
Tools
- Training & Zertifizierung
- Eigenes Konto
- Kundensupport
- Für Entwickler
- Partner finden
- Red Hat Ecosystem Catalog
- Mehrwert von Red Hat berechnen
- Dokumentation
Testen, kaufen und verkaufen
Kommunizieren
Über Red Hat
Als weltweit größter Anbieter von Open-Source-Software-Lösungen für Unternehmen stellen wir Linux-, Cloud-, Container- und Kubernetes-Technologien bereit. Wir bieten robuste Lösungen, die es Unternehmen erleichtern, plattform- und umgebungsübergreifend zu arbeiten – vom Rechenzentrum bis zum Netzwerkrand.
Wählen Sie eine Sprache
Red Hat legal and privacy links
- Über Red Hat
- Jobs bei Red Hat
- Veranstaltungen
- Standorte
- Red Hat kontaktieren
- Red Hat Blog
- Diversität, Gleichberechtigung und Inklusion
- Cool Stuff Store
- Red Hat Summit