The general availability of hosted control planes (HCP) for self-managed Red Hat OpenShift Virtualization (KubeVirt) is an exciting milestone. However, the true test lies in system performance and scalability, which are both crucial factors that determine success. Understanding and pushing these limits is essential for making informed decisions. This article offers a comprehensive analysis and general sizing insights for consolidating existing bare metal resources using hosted control planes for self-managed OpenShift Virtualization. It delves into the resource usage patterns of the hosted control planes, examining their relationship with the KubeAPIServer QPS rate. Through various experiments, we established the linear regression model between the KubeAPI Server QPS rate and CPU/Memory/ETCD storage utilization, providing valuable insights for efficient resource consolidation and node capacity planning.
Cluster configuration
By default, Kube-scheduler assigns pods to all schedulable nodes, often leading to HCP pods and virtual machine (VM) worker pods co-hosting on the same node. Even master nodes can be made schedulable to host pods. However, to ensure a clear division of responsibilities, minimizing interference or "noise" in the cluster for clean and reliable data, we've configured this cluster topology:
Cluster
│
├── Control Plane (Masters)
│   ├── master-0
│   ├── master-1
│   └── master-2
│
└── Workers
   ├── Standard Workers
   │   ├── worker000
   │   ├── worker001
   │   ├── worker002
   │    ……………………
   │   ├── worker023
   │   ├── worker024
   ├── Hosted Control Plane
   │   ├── worker003 (zone-1)
   │   ├── worker004 (zone-2)
   │   └── worker005 (zone-3)
   ├── Infra Node for Prometheus
       ├── worker025 (promdb)
       └── worker026 (promdb)
The management cluster includes three master nodes and 27 worker nodes. Specifically, three nodes (worker003-005) are dedicated to the hosted control plane pods, while two infrastructure nodes (worker025-026) support the Prometheus management pods. The remaining standard worker nodes host KubeVirt VMs.
The software environment used in this article:
- OpenShift Container Platform (OCP) 4.14
- OpenShift Virtualization (CNV) 4.14
- Multicluster Engine (MCE) 2.4
This table shows the cluster environment:
CPU | RAM | Storage | |
Bare Metal | 64 hyperthreads | 256 GiB | 1TB (NVMe) |
VM Worker | 8 vCPUs | 32 GiB | 32 GiB (PV) |
Each bare metal node is equipped with an Intel(R) Xeon(R) Gold 6130 CPU @ 2.10GHz processor consisting of two sockets x 16 cores x two threads for a total of 64 threads, with 256 GiB of RAM spanning across two NUMA nodes and one extra 1TB of NVMe disk.
We allocated eight vCPUs, 32GiB of RAM, and 32 GiB of Persistent Volume (PV) for VM work. Our sizing experiment is based on a Highly Available (HA) hosted cluster with nine VM worker nodes. One VM worker node is dedicated to the guest cluster monitoring stack, and benchmarking workloads are running on the remaining eight VM workers.
ETCD and VM storage
To meet the latency requirements of ETCD, the LVM operator is used to configure a local storage class that leverages fast NVMe devices on worker003 to worker005.
Hostpath Provisioner (HPP) is used for provisioning NVMe disks from standard worker nodes (worker000 to worker024, excluding HCP nodes) to back the root volumes of the VMs.
Methodology
CPU, memory, and ETCD storage utilization measurements were conducted for hosted clusters scaled across multiple dimensions, particularly focusing on the increase in KubeAPI load. Kube-burner was used to generate this API load. This tool works by creating a multitude of objects within a namespace and then continuously churning them—that is, deleting and recreating them repeatedly over 15 minutes.
An idle cluster, where no object creation occurs, served as the baseline for comparison. The experiment progressively increased the workload from this baseline by creating two, four, and six namespaces, introducing a three-minute delay between each increment. This process continued up to a total of 100 namespaces. During these 15-minute intervals, both the maximum and average data points were extracted.
This approach allowed for a detailed analysis of how the API rate correlates with resource use, providing insights into the growth relationship between increased API rate and the corresponding demand on cluster resources. This data is useful for understanding the scalability and performance characteristics of the hosted clusters under high API bursts.
Workload profile
The workload profile is a cluster density test. The following points describe the detailed workload used to provide this example load data:
- The image stream and build components were removed to focus the utilization measurements on API/control-plane stress.
- The workload creates several objects (configmaps, secrets, services, replicasets, deployments, routes, network policies) + 10 pods per namespace. It ramps up each iteration until 100 namespaces are created (for example, 1,000 pods per hosted cluster).
- The churn value is set to 100% to cause additional API stress with continuous object deletion and creation.
Prometheus queries
The QPS (Queries Per Second) and BURST parameters were set by Kube-burner on the golang client to 10,000 (QPS=10000 BURST=10000), essentially removing any limits on the client side to max out API usage. Server side QPS/BURST limit is kept at default of 1000 and 3000 for mutating and non-mutating queries respectively. The achieved QPS rate was queried as follows, counting all requests within the namespace, including both reads and writes.
sum(rate(apiserver_request_total{namespace=~"clusters-$name*"}[2m])) by (namespace)Container CPU usage
Because all the virt-launcher and pvc importer pods are running in the same namespace as the hosted control plane pods, we exclude them in our calculation.
sum(irate(container_cpu_usage_seconds_total{namespace=~"clusters-kv.*",container!="POD",name!="", container!="", pod!="", pod!~"virt-launcher-kv-.*|importer-kv.*"}[2m])*100) by (namespace)Container RSS memory
Resident set size memory is used to estimate the container memory utilization.
sum(container_memory_rss{namespace=~"clusters-kv.*", container!="POD", container!="", pod!="", pod!~"virt-launcher.*|importer-kv.*"}/1024/1024/1024) by (namespace) KubeAPI load and resource utilization
We studied the resource usage pattern at increasing API rates to provide sizing insights more specifically tuned to the desired hosted cluster load. This scaling calculation is building in burstable resources for each hosted control plane to handle certain load points in a performant manner.
The resource scaling charts below demonstrate the observed hosted control-plane resource usage as the achieved QPS rate increases throughout the test, demonstrating control plane load scaling. Please note that the data plane workload itself may or may not generate a consistent high QPS rate.
The solid line in the charts represents a scaling formula using linear regression, which is a good estimating factor based on measured utilization data. One can size the hosted cluster based on the detailed analysis described in the following sections.
Average QPS and average CPU
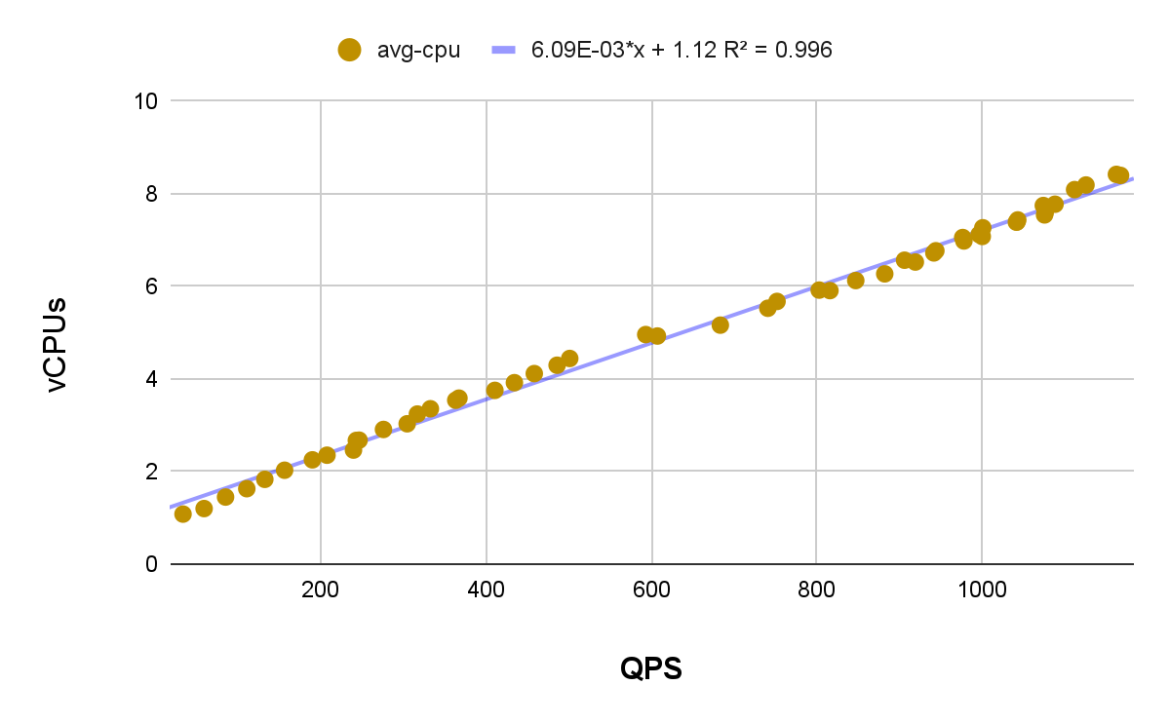
Consider the desired hosted cluster API load when determining the amount of CPU resources that should be available for bursting. The plot above shows the linear relationship between the average CPU utilization of all HCP pods and the average QPS rate during each run.
The extracted data points yield a coefficient of determination (R²) value of 0.996, indicating an almost perfect fit in the linear regression line. To interpret the graph, consider a specific data point, like (600, 5). This means that with an average request rate of 600 queries handled by all KubeAPI servers over 15 minutes, the average CPU consumption should be around five vCPUs.
The equation displayed on the plot can be used to predict average CPU consumption based on the average QPS input variable x, with a theoretical maximum of 3000 * 3. Beyond this point, kubeAPI servers are likely to start throttling, preventing uncontrolled growth in resource consumption.
The example utilization scaling above is based on the average CPU usage of each Hosted Control Plane throughout the workload run. However, CPU usage spikes can vary up to ~2x higher than the average. Consider factoring in extra CPU resources per cluster if some CPU overcommit is not desired.
Maximum QPS and maximum CPU
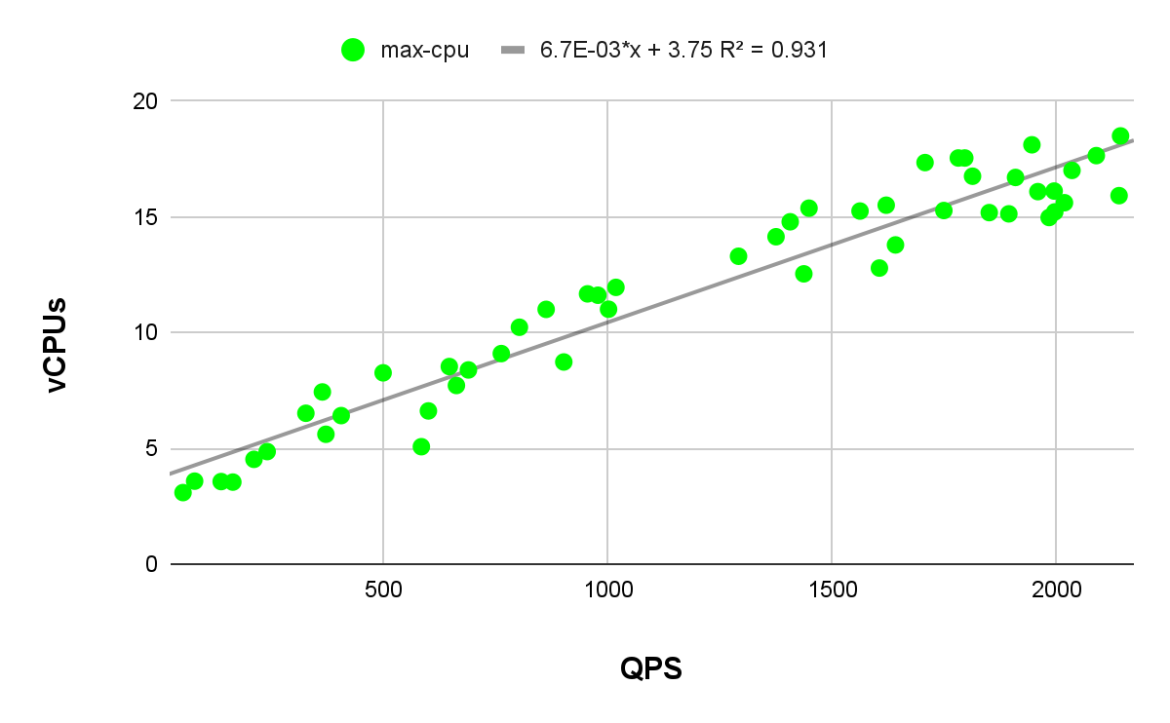
Modeling the relationship between the maximum CPU utilization of HCP pods and the maximum QPS rate can be tricky due to periodical CPU spikes from events like catalog pod dumps, which aren't directly triggered by QPS bursts. Despite this, the linear regression line for max CPU consumption has a coefficient of determination value of 0.931. Although slightly lower, it still provides a solid fit and reliable estimates for maximum CPU consumption during QPS bursts.
Average QPS and average memory
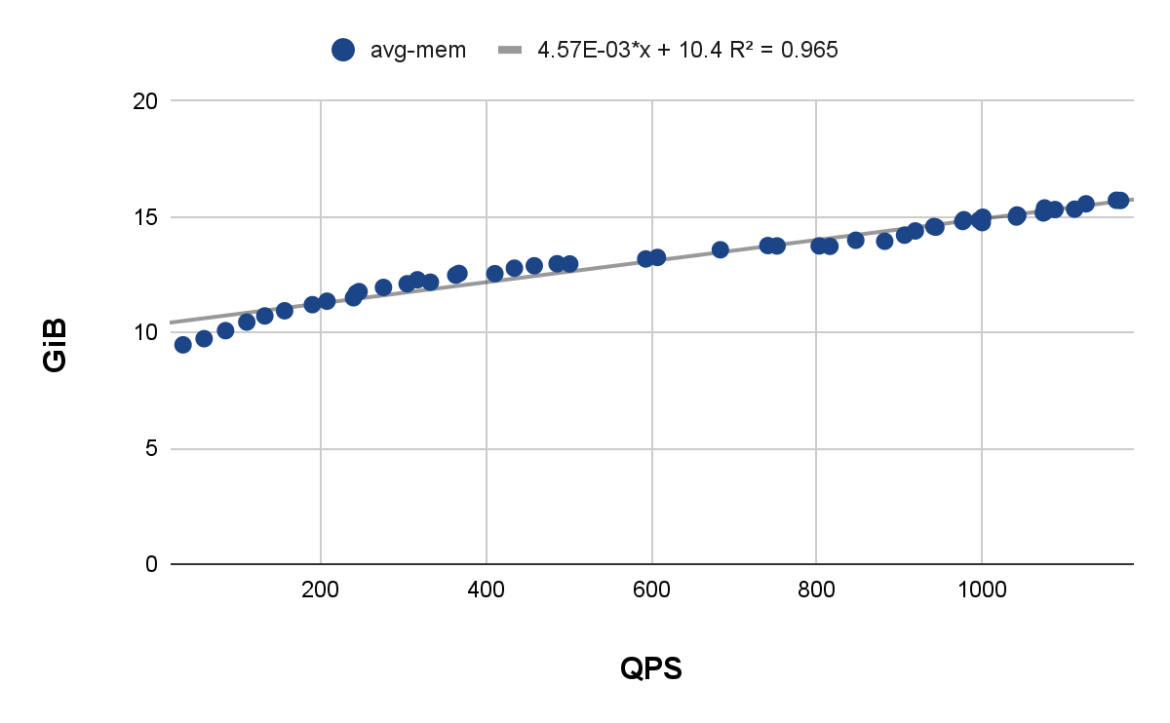
The default memory request for each hosted control plane is approximately 18 GiB. Observations show that hosted control plane pods typically consume around 15 GiB of RAM at an average QPS rate of 1,000. This generous memory allocation for requests likely aims to prevent Out Of Memory (OOM) conditions.
Maximum QPS and maximum memory
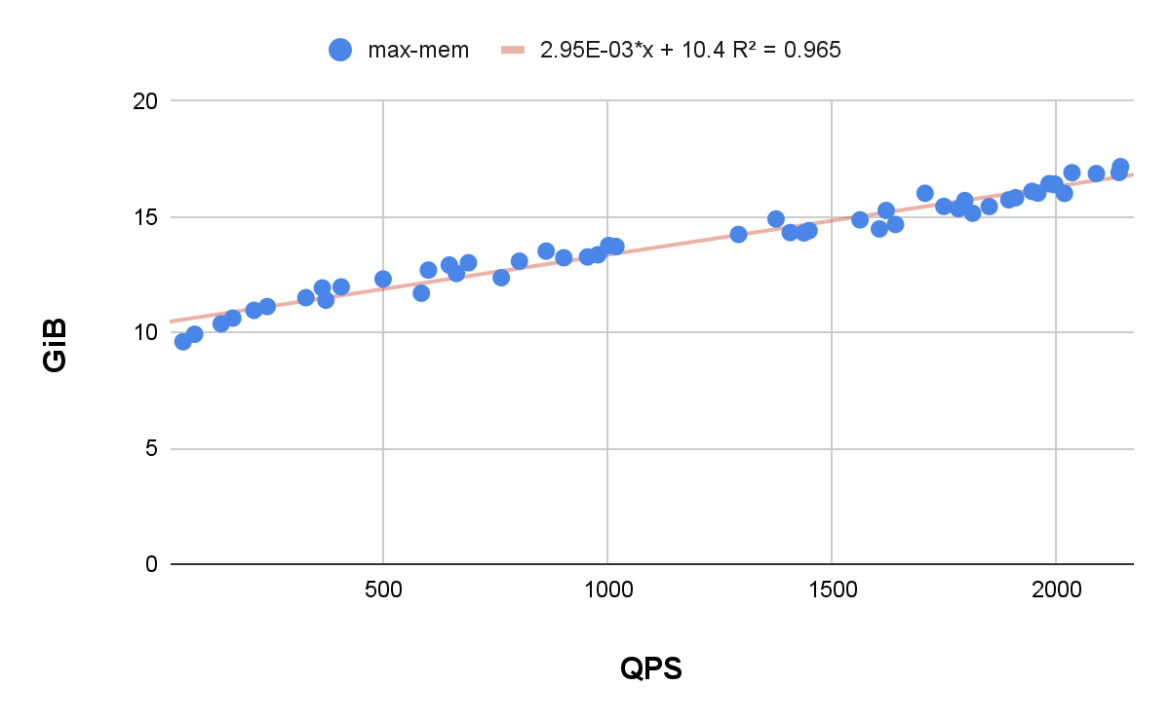
Maximum QPS (queries per second) rate versus maximum memory utilization in the hosted control plane pods follows a trend similar to that observed in the average QPS rate plot. Even when the QPS rate spiked to 2,000, there was no significant increase in the memory consumption of the hosted control plane pods. This indicates that the memory utilization has been fairly consistent, even under conditions of high query load.
Hosted cluster ETCD DB scaling
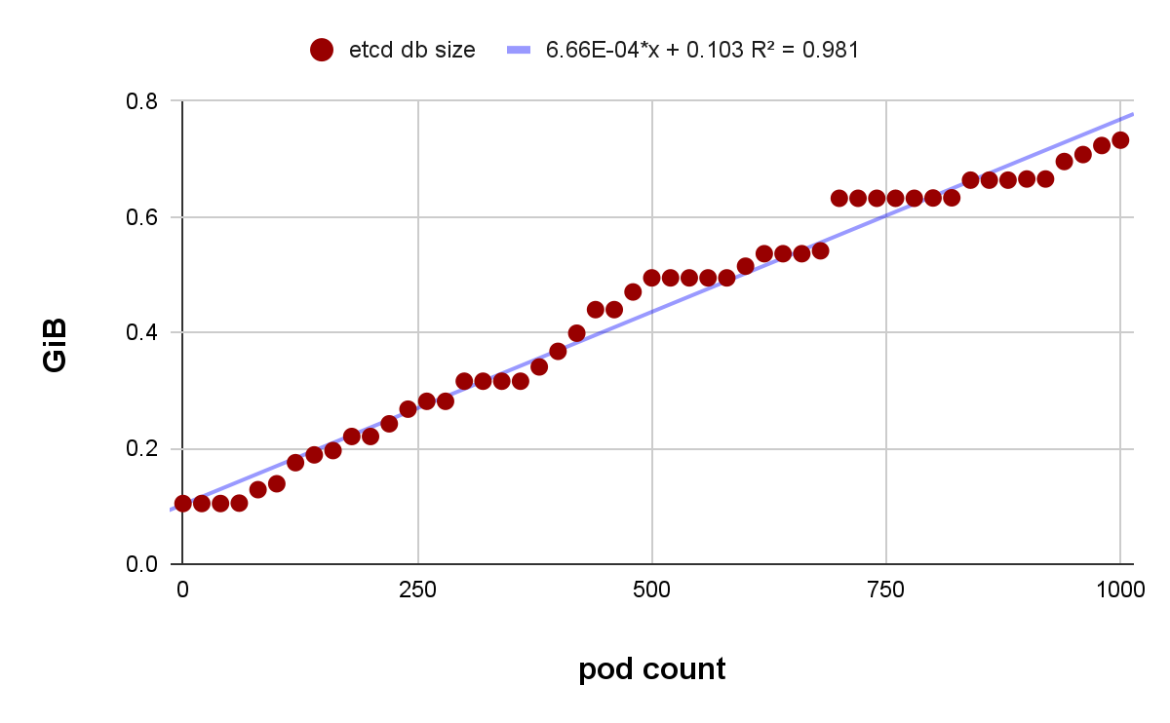
The hosted cluster ETCD database size expands with the increasing number of pods and related objects such as configmaps and secrets. Under the previously described workload profile, the linear regression line indicates that the database could remain within the default eight GiB PVC size limit until it reaches roughly 11,000 pods and associated objects without defragmentation. The plateau showing in the graph is likely a result of ETCD auto compaction.
Pattern analysis
The workload profile used for this article is entirely simulated using the Kube-burner benchmark tool. This tool creates conditions in a controlled environment that may not typically occur in a real-world production scenario. Specifically, the high API burst rate generated is less common than what you will likely encounter in a production environment. However, it's still valuable for understanding performance and scaling limits and identifying cluster bottlenecks.
Read the hosted control plane sizing guidance documentation for general sizing guidance regarding request size, pod limits, and more.
In the future, we aim to deploy realistic workloads, potentially using ArgoCD, to simulate real-world scenarios better and enhance our understanding of HCP resource usage patterns.
Acknowledgment
I extend my sincere gratitude to Michey Mehta for his contribution to data analysis and technical input and Jenifer Abrams for her leadership and substantial contribution to the sizing guidance document, which significantly shaped this blog. Additionally, my appreciation goes out to the entire OpenShift Virtualization Performance & Scale team for their consistent and insightful contributions throughout this process. Finally, a big shoutout to Will Foster, Kambiz Aghaiepour, and the entire Scale Lab team for providing the bare metal machines and help troubleshooting hardware issues. Their collective efforts have been invaluable and are deeply appreciated.
저자 소개
I mainly focus on HyperShift/KubeVirt project, a multi-cluster Kubernetes engine that uses KubeVirt, enabling the running of KVM virtual machines alongside containers. The goal is to identify limitations and improve performance and scalability. My responsibilities include deploying large-scale on-premise clusters, contributing to the CI/CD pipeline, developing automation tools, and conducting performance analyses on ETCD, OVN networking, and ODF storage.
채널별 검색
오토메이션
기술, 팀, 인프라를 위한 IT 자동화 최신 동향
인공지능
고객이 어디서나 AI 워크로드를 실행할 수 있도록 지원하는 플랫폼 업데이트
오픈 하이브리드 클라우드
하이브리드 클라우드로 더욱 유연한 미래를 구축하는 방법을 알아보세요
보안
환경과 기술 전반에 걸쳐 리스크를 감소하는 방법에 대한 최신 정보
엣지 컴퓨팅
엣지에서의 운영을 단순화하는 플랫폼 업데이트
인프라
세계적으로 인정받은 기업용 Linux 플랫폼에 대한 최신 정보
애플리케이션
복잡한 애플리케이션에 대한 솔루션 더 보기
오리지널 쇼
엔터프라이즈 기술 분야의 제작자와 리더가 전하는 흥미로운 스토리
제품
- Red Hat Enterprise Linux
- Red Hat OpenShift Enterprise
- Red Hat Ansible Automation Platform
- 클라우드 서비스
- 모든 제품 보기
툴
체험, 구매 & 영업
커뮤니케이션
Red Hat 소개
Red Hat은 Linux, 클라우드, 컨테이너, 쿠버네티스 등을 포함한 글로벌 엔터프라이즈 오픈소스 솔루션 공급업체입니다. Red Hat은 코어 데이터센터에서 네트워크 엣지에 이르기까지 다양한 플랫폼과 환경에서 기업의 업무 편의성을 높여 주는 강화된 기능의 솔루션을 제공합니다.

