
This article aims to benchmark the results for 100 Gbps network interface assets and develop tools for driving the load.
Recently, a customer faced a network test issue in which the anticipated bandwidth was observed at the node level, but there was a reduction of 25% to 30% at the pod level. The customer could resolve the issue by using HostNetwork for the pods because it bypasses OVN-K hops. However, this approach can have security implications, so that's not the ideal solution.
The analysis further revealed that the customer application exhibited low latency and high packets per second (PPS), especially when routing traffic directly through the host network interface. The customer's environment had bare metal worker nodes, each equipped with two 100GB NICs. I tested the network with iPerf3 and validated the network speeds between pods. No automated procedure to conduct these tests existed. The customer is actively seeking a script to validate the scenario.
Get started
I conducted a large-scale network test for Red Hat OpenShift clusters hosted on bare metal Linux worker nodes. I chose iPerf3 and k8s-netperf to stress the network component by saturating the 100Gbps network.
k8s-NetPerf
This is a client-server model with two executables: netperf and netserver. You can execute netperf on the remote system's inetd or as a standalone daemon. netperf establishes a "control connection" to the remote system when executed, which passes test configuration information and results to and from the remote system. Regardless of the test type, the control connection is TCP-based and implemented by BSD sockets. The control connection can use IPv4 or IPv6. Once the control connection is active and you supply the configuration information, it establishes a separate "data" connection for the measurement using the API and protocol appropriate for the test.
The data connection is terminated upon completion. The results from the netserver are passed back through the control connection and combined with netperf results for display. netperf places no traffic on the control connection while a test is in progress.
Specific TCP options, such as SO KEEPALIVE, may put packets out on the control connection while a test is in progress. Generally speaking, this does not affect the results.
I use k8s-netperf to perform the following tests:
- Test end-to-end latency (round-trip times or RTT).
- Establish one thread per stream.
iPerf3
iPerf is a tool for actively measuring the maximum achievable bandwidth on IP networks. It supports tuning parameters related to timing, protocols, and buffers.
The client node generates traffic towards the server node. iPerf measures network throughput and displays an estimate of network speed between the client and server. For each test, it reports the measured throughput and bitrate, loss, and other parameters.
I used the multithreaded beta release of iPerf3 in my tests. iPerf3 is a new implementation with the goal of a smaller, simpler code base and a library version of the functionality you can use in other programs. It's useful in the following cases:
- Tests packet loss and delay jitter.
- Troubleshooting network performance.
- Multiple threads per process.
Choosing one or the other tool depends on the use case.
Testbed topology
The infrastructure consisted of three Master Nodes and eight Worker Nodes. The Master and Compute Nodes were Dell PowerEdge R650 Servers, each equipped with a 100Gb/S physical interface backed by a Mellanox network controller. Here is the server topology in the OpenShift diagram.
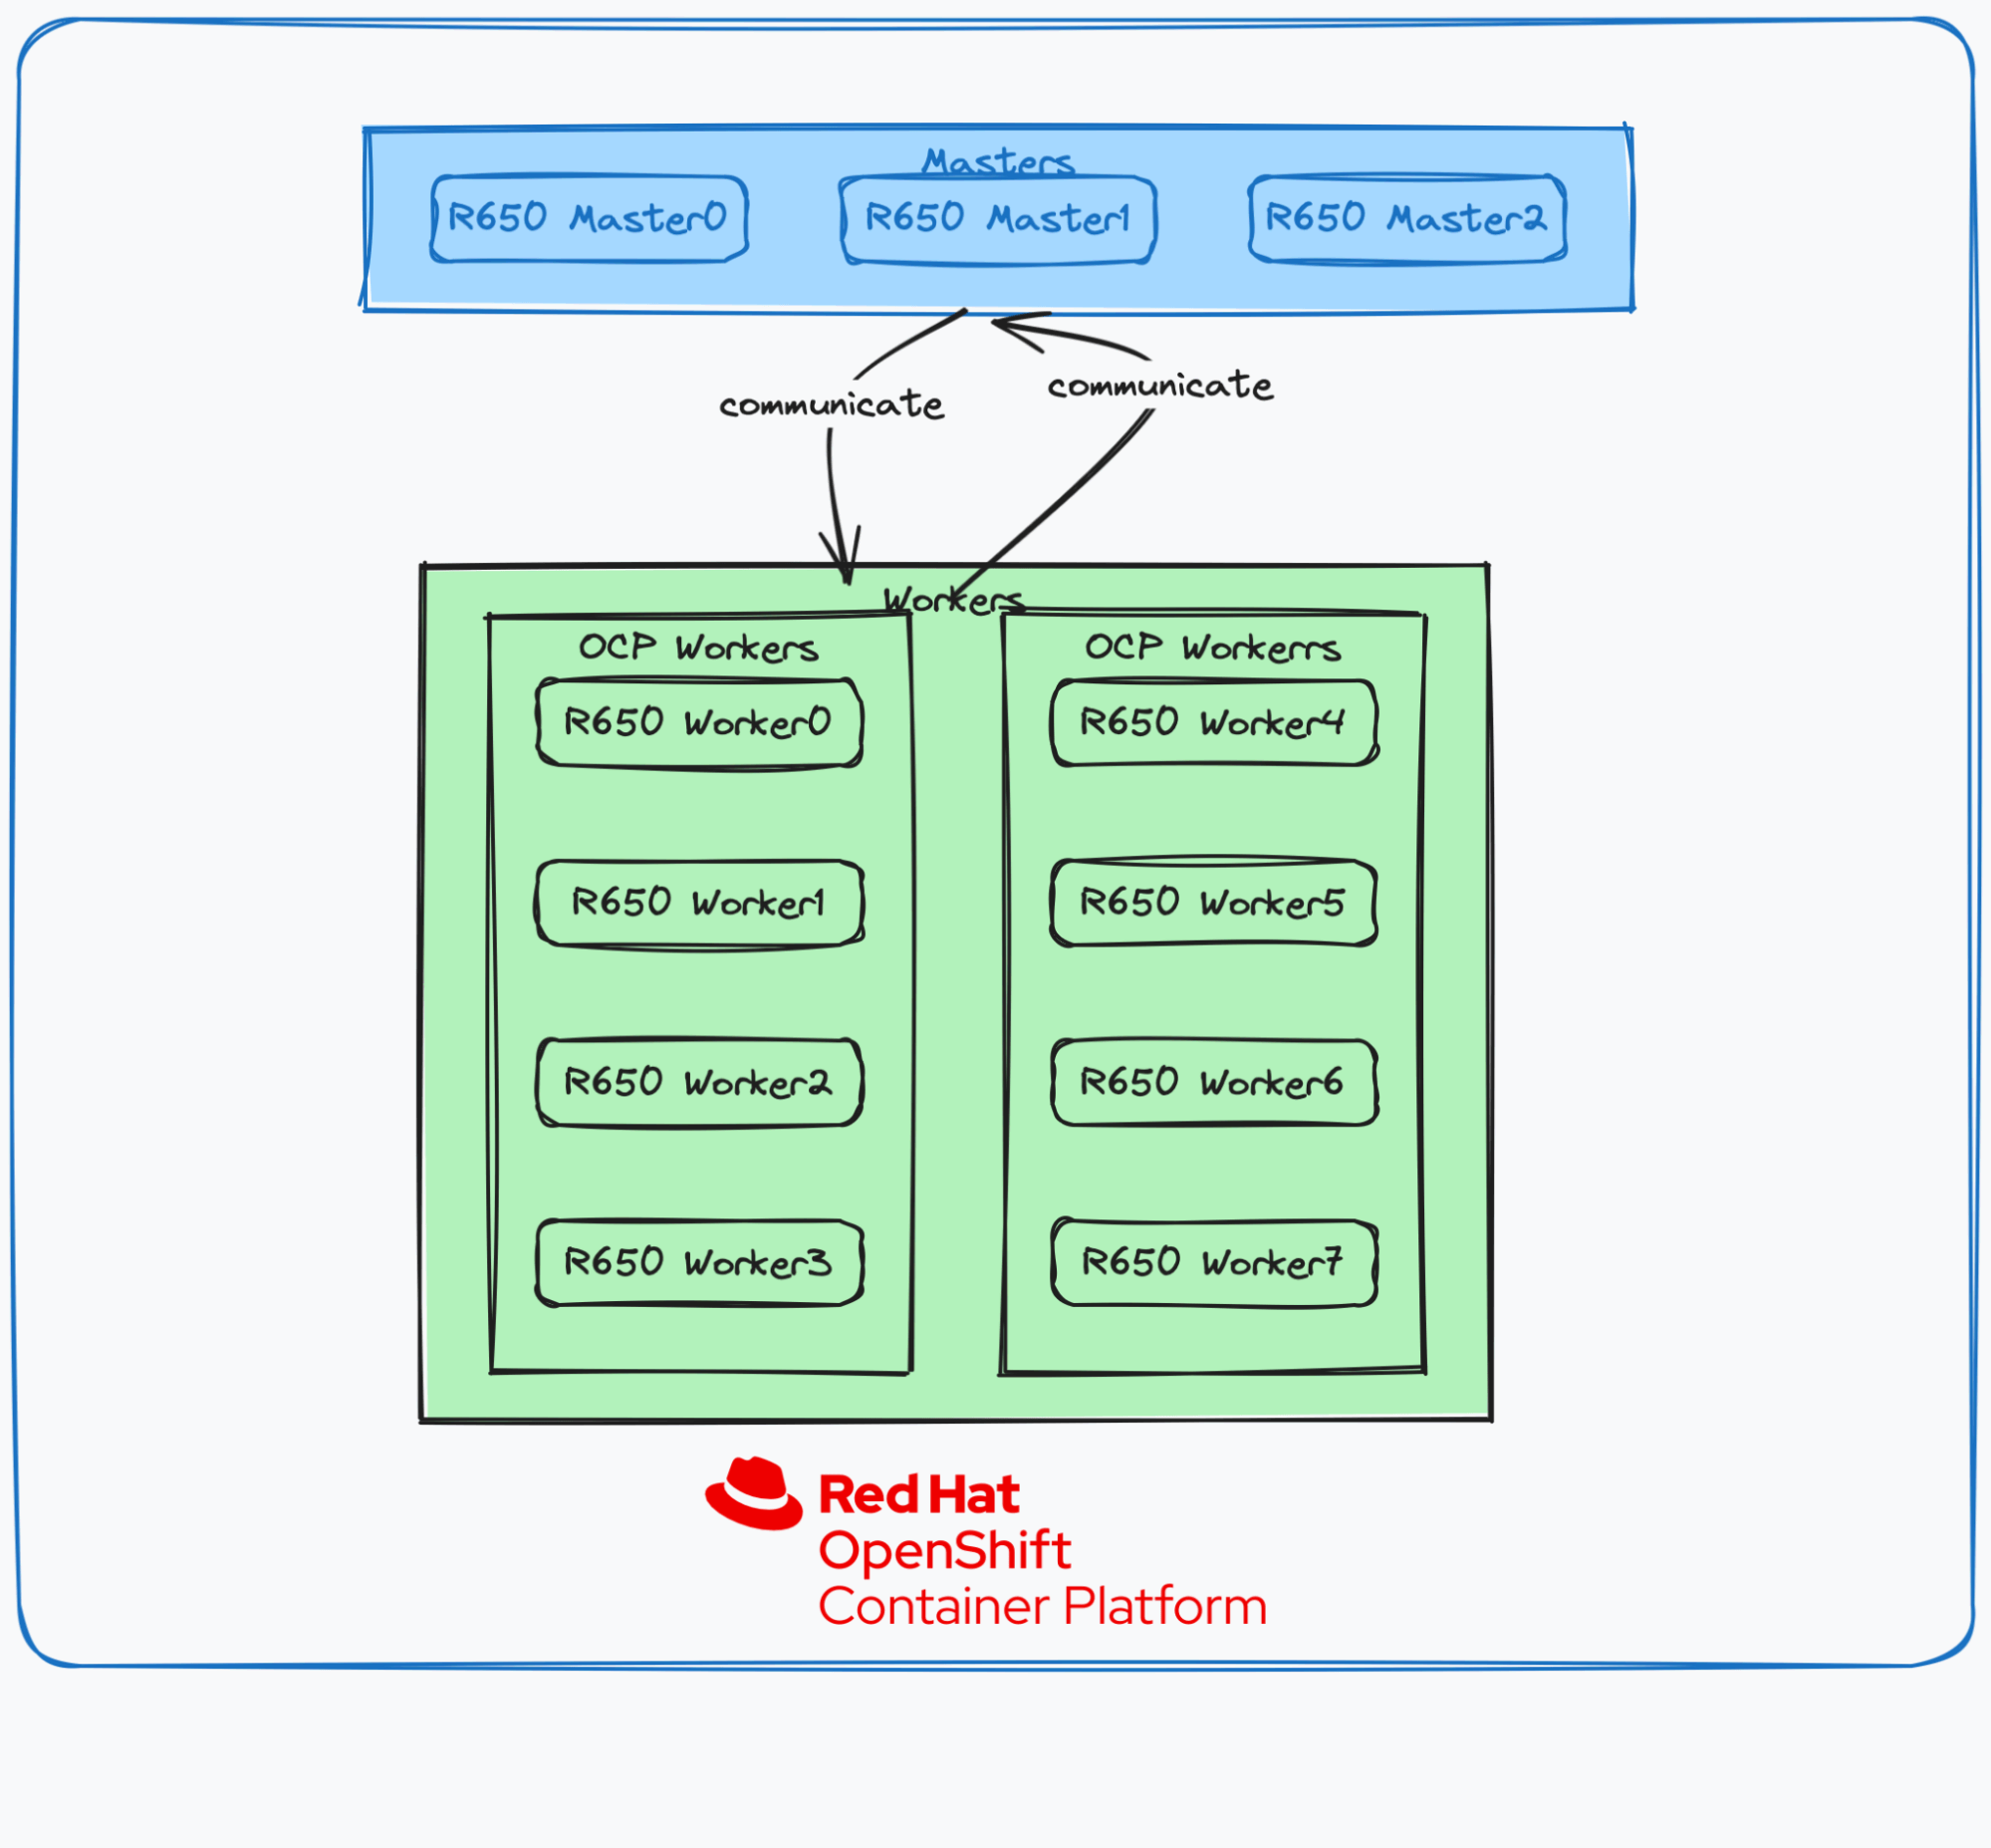
Baremetal Server topology in OpenShift deployment
Hardware stack
I performed the test on internal lab hardware consisting of 12 x Dell R650 servers. Each server is equipped with the following:
- CPU: 28 Physical cores - Dual Socket (56 Threads)
- Model name: Intel(R) Xeon(R) Gold 6330 CPU @ 2.00GHz
- Physical network interface: 100Gb/s
- Ethernet controller: Mellanox Technologies MT28908 Family [ConnectX-6]
- Disk: Micron Technology Inc 7450 PRO NVMe SSD
- SATA-attached SSD: C620 Series Chipset Family SATA Controller
- Memory: DDR4, 512GB
Software stack
The software stack includes the following components:
- OpenShift: 4.13.17
- oc-client: 4.13.17
- k8s-netperf: v0.1.16
- Go Version: 1.19
Build and execution
This section describes how to build the k8s-netperf locally for an alternate architecture.
$ git clone http://github.com/cloud-bulldozer/k8s-netperf -b v0.1.16
$ cd k8s-netperf/
$ make build
k8s-netperf configuration
This section captures the configuration leveraged during k8s-netperf testing. This configuration will execute five samples. Each sample has a duration of 60 seconds with a payload size of 16KB.
---
tests:
 - TCPStream:
   parallelism: 30
   profile: "TCP_STREAM"
   duration: 60
   samples: 5
   messagesize: 16384
I cloned e2e-benchmarking to trigger the network testing. You need a KUBECONFIG pointing to the cluster you want to run k8s-netperf against. The custom configuration used allows user to different combinations
$
$ git clone https://github.com/cloud-bulldozer/e2e-benchmarking
$ cd e2e-benchmarking/workloads/network-perf-v2/
$ export WORKLOAD=full-run.yaml  <--- Points to our custom configuration
$ ./run.sh
The above command will run the workload and generate output.
You can get the scripts from this GitHub repo.
Results analysis
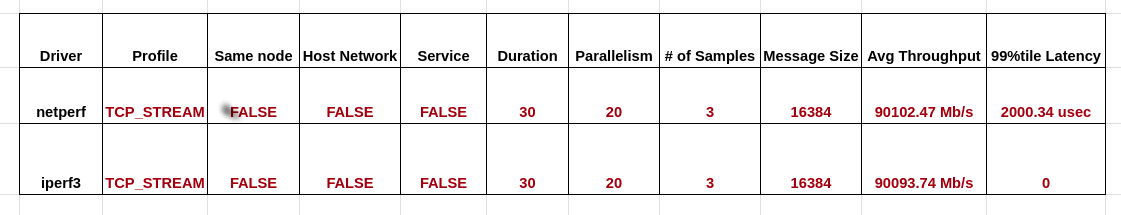
Using netperf and iPerf3 with 25 clients demonstrated the capability to drive network tests reaching ~95Gbps with a 1500 MTU and 16384k msg_size without system tuning, indicating confidence in the network tools employed and allowing users to drive large-scale network testing.
Output:
Pod2Pod network perf test result:
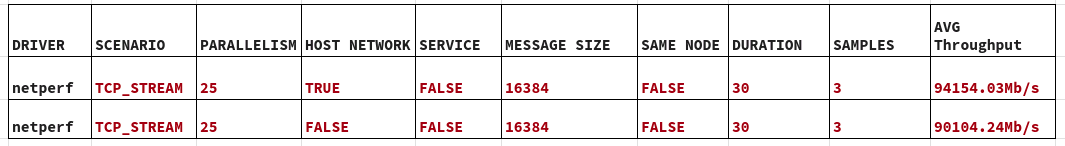
Host network perf test results:
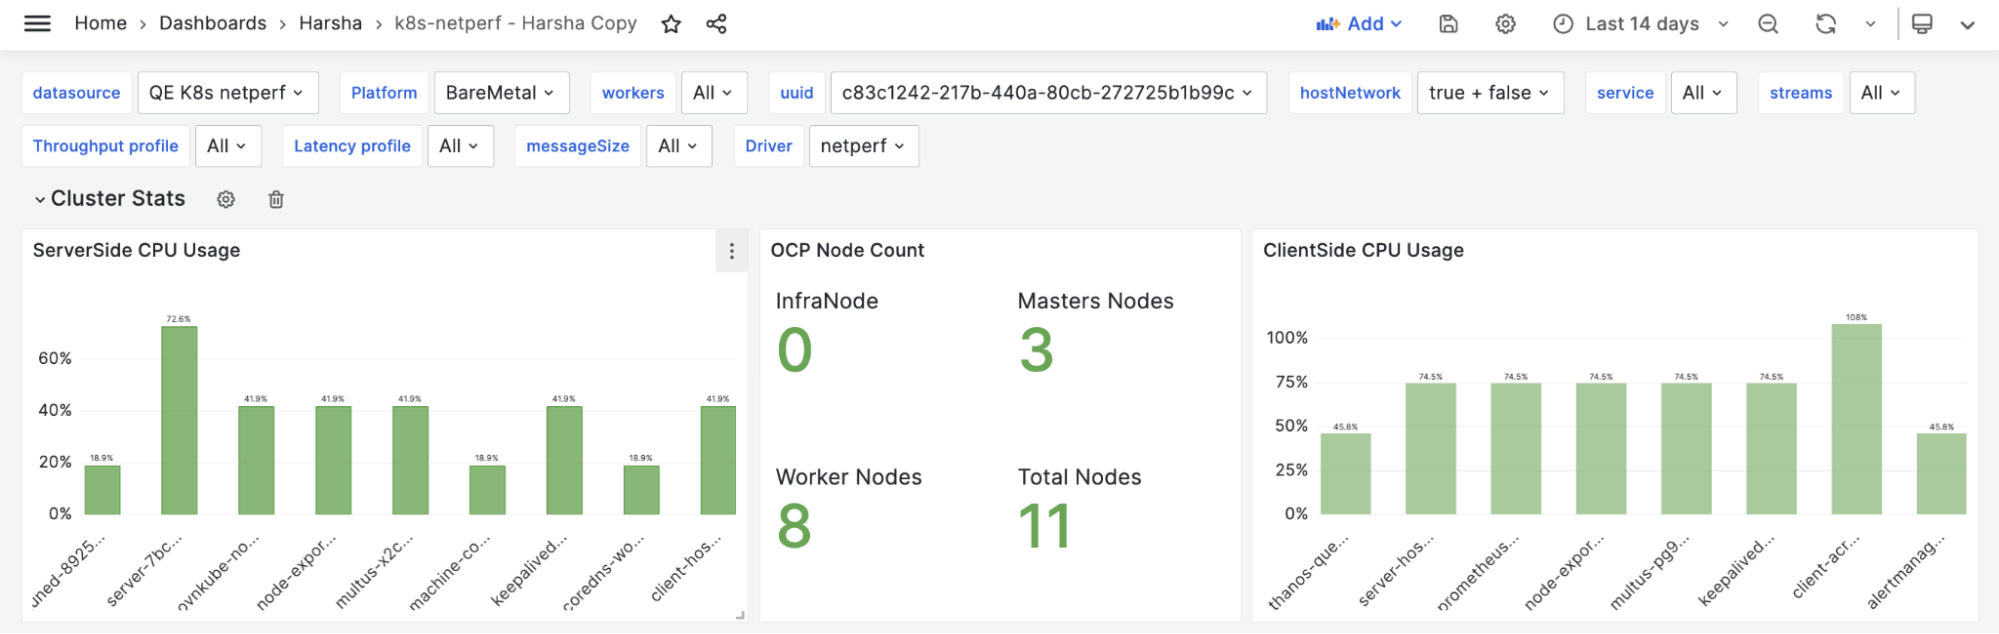
The ServerSide CPU usage peaked at 72% for 25 streams, whereas the ClientSide experienced a CPU usage that reached 108%.
The CPU Usage for the default (one) stream peaked on the ServerSide at 18%, while on the ClientSide, it reached 45%.
Wrap up
The large-scale network testing focusing on a 100 Gbps approach on OpenShift provided valuable insights into the system performance. The analysis revealed a reduction in bandwidth at the pod level, prompting exploration of solutions such as using HostNetwork for pods, albeit with associated security considerations.
The evaluation incorporated tools like k8s-netperf and iPerf3, leveraging a robust infrastructure of Dell PowerEdge R650 servers equipped with 100Gb/s interfaces and backed by Mellanox network controllers. The tests, executed with careful consideration of hardware and software stacks, demonstrated the ability to drive network tests at approximately 95Gbps, showcasing the effectiveness of the network tools employed, including k8s-netperf (Netperf and iPerf3).
저자 소개

I have been associated with Redhat since Jan 2021, working on OpenShift. Responsible for Features, Performance and scalability of OpenShift, OpenVirtual Network-Kubernetes.

Krishna Harsha Voora grew up in different regions and experienced different cultures of India, he fell in love with computers after reading about First Generation Computer and it's evolution! This carried into degree in Computer Science & Engineering. After Engineering, he is currently working as Senior Software Engineer in Red Hat India Pvt. Ltd.
채널별 검색

오토메이션
기술, 팀, 인프라를 위한 IT 자동화 최신 동향

인공지능
고객이 어디서나 AI 워크로드를 실행할 수 있도록 지원하는 플랫폼 업데이트

오픈 하이브리드 클라우드
하이브리드 클라우드로 더욱 유연한 미래를 구축하는 방법을 알아보세요

보안
환경과 기술 전반에 걸쳐 리스크를 감소하는 방법에 대한 최신 정보

엣지 컴퓨팅
엣지에서의 운영을 단순화하는 플랫폼 업데이트

인프라
세계적으로 인정받은 기업용 Linux 플랫폼에 대한 최신 정보

애플리케이션
복잡한 애플리케이션에 대한 솔루션 더 보기

오리지널 쇼
엔터프라이즈 기술 분야의 제작자와 리더가 전하는 흥미로운 스토리
제품
- Red Hat Enterprise Linux
- Red Hat OpenShift Enterprise
- Red Hat Ansible Automation Platform
- 클라우드 서비스
- 모든 제품 보기
툴
체험, 구매 & 영업
커뮤니케이션
Red Hat 소개
Red Hat은 Linux, 클라우드, 컨테이너, 쿠버네티스 등을 포함한 글로벌 엔터프라이즈 오픈소스 솔루션 공급업체입니다. Red Hat은 코어 데이터센터에서 네트워크 엣지에 이르기까지 다양한 플랫폼과 환경에서 기업의 업무 편의성을 높여 주는 강화된 기능의 솔루션을 제공합니다.