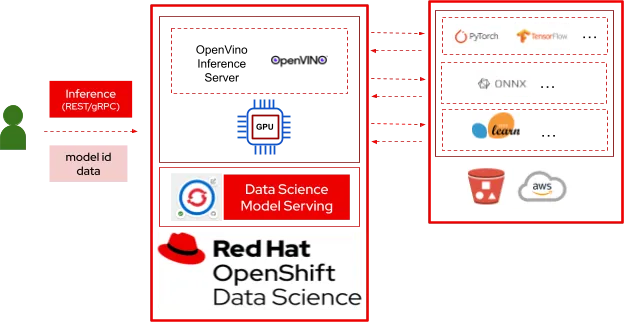
Figure 1. Model Serving in Red Hat OpenShift Data Science
In order to gather insights from vast amounts of customer data and drive business needs, organizations need to build intelligent applications and integrate these applications into their existing software stack. An important aspect of gaining business insights is deploying intelligent applications at scale and continuing to monitor the applications in real time. With the advancement of machine learning techniques and the size of such machine learning applications, the number of model parameters and the inference workloads are also increasing. In order to meet such increasing demands of modern machine learning applications, Red Hat OpenShift Data Science provides a rich set of features to serve multiple model formats through a single endpoint as well as supports model serving with GPUs. To monitor success and performance, users can install Prometheus to capture inference metrics from deployed models.
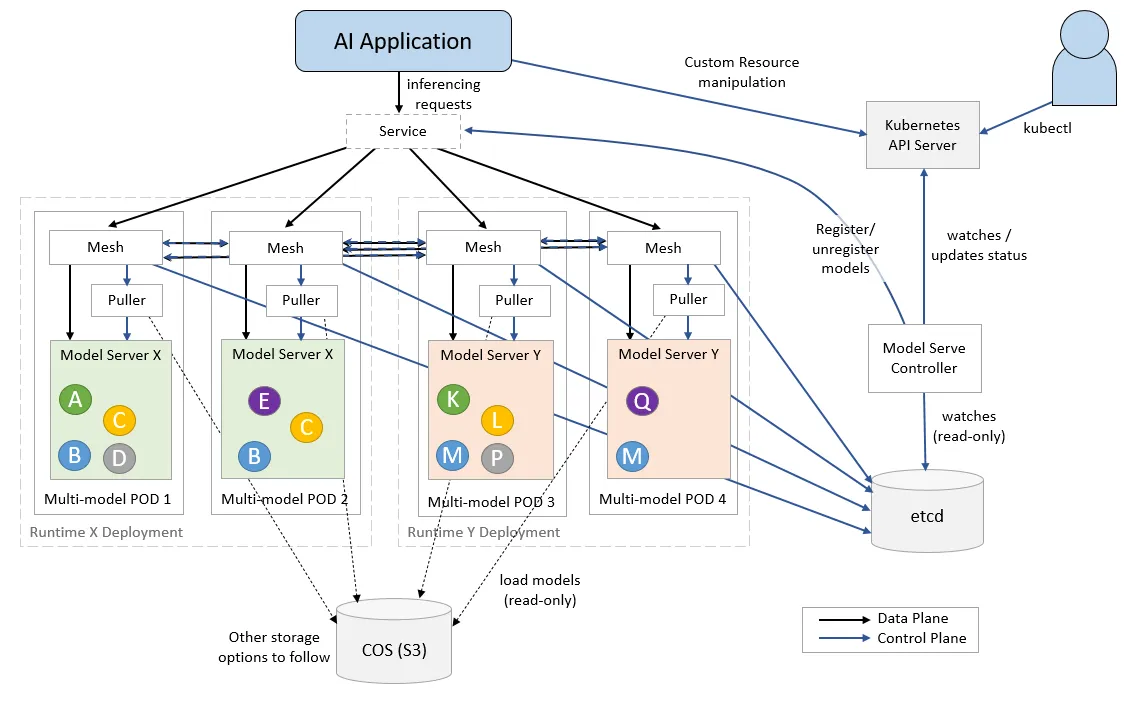
Red Hat OpenShift Data Science addresses this challenge of increasing computational overhead associated with a single model per pod deployment by incorporating KServe Modelmesh. Modelmesh is designed for high-scale, high-density, and frequently-changing model serving use cases. It allows efficient use of network, cpu, and memory resources by serving multiple models per pod. It implements this by intelligently loading and unloading models to and from cache by balancing the trade-offs between model responsiveness and their computational footprint.
In the KServe modelmesh serving architecture diagram below, we highlight how modelmesh loads multiple models in a single model server pod within a serving runtime. The models are labeled with color coded letters. These models are retrieved from the storage by the puller service. The inference requests are intelligently routed via mesh based on a least-recently used cache. Multiple copies of the same model are deployed dynamically based on the usage of the mode to maximize availability under load.
Figure 1 shows the overall architecture of model serving within Red Hat OpenShift Data Science. OpenShift Data Science is a hybrid cloud AI platform to train, serve, monitor, and manage AI/ML models and intelligent applications, and part of Red Hat OpenShift AI, a portfolio of artificial intelligence and machine learning operations (MLOps) tools, Red Hat OpenShift Data Science model serving uses Kserve ModelMesh technology, a distributed model serving framework designed for scalability and high volume inference workloads. Users typically store their models in a backend storage environment. Then OpenVINO model server instances with GPUs enabled are created which remain inactive until models are deployed. Once a model is deployed, the corresponding model server instance becomes active, downloads the model from the backend storage and becomes ready to serve inference requests. Users can now get predictions by sending in the data through the inference endpoint.
Here’s how users can easily deploy machine learning models, perform inference requests and track inference metrics using Red Hat OpenShift Data Science and Prometheus.
Training models in OpenShift Data Science with GPUs
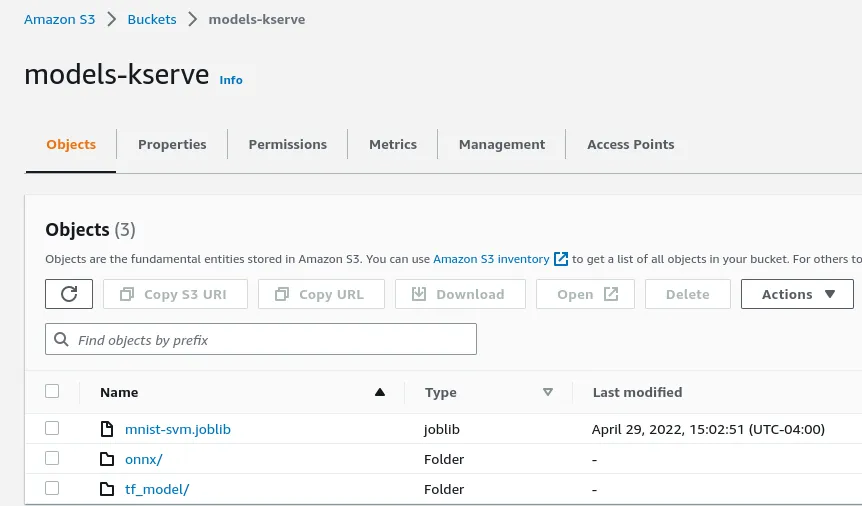
Storing Models in S3
Store the machine learning models in S3 bucket as follows. Users need to convert the model into ONNX format. Please refer to the documentation here for converting models trained using frameworks like Tensorflow, PyTorch, Scikit-learn etc., into ONNX format.
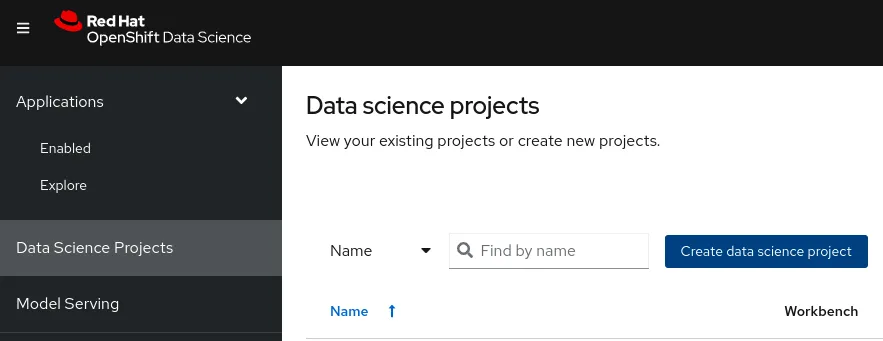
Create Data Science Project
Create a data science project with the Name -> modelserving-test. Note that the resource name gets filled automatically.
Create data connections to access stored models
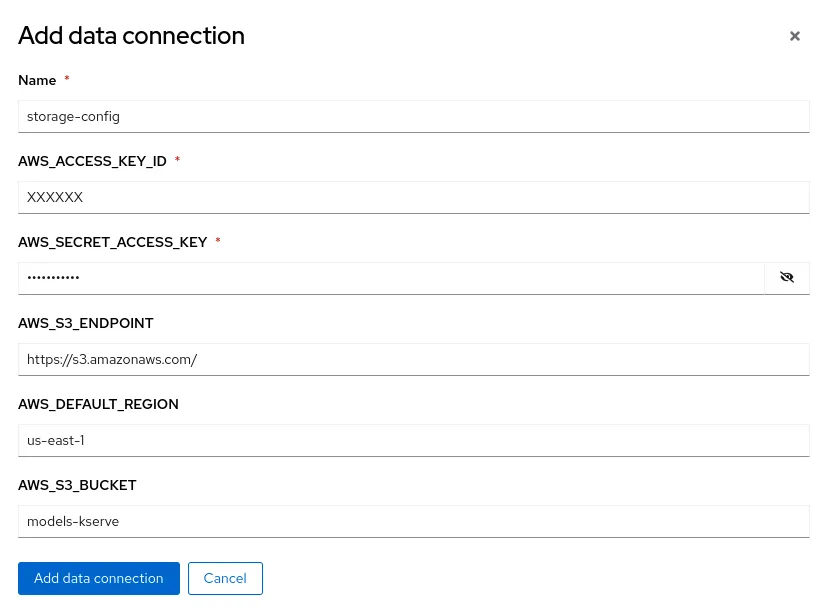
Once a data science project is created, go to the project and click on Data connections -> Add data connection. Use the appropriate AWS S3 credentials to create access to the models in the S3 bucket.
Configure Model Server
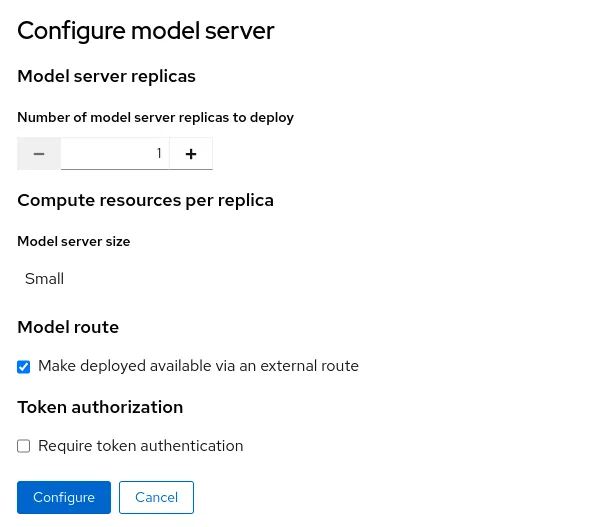
Click on Models and model servers -> Configure Server. Select the desired number of replicas and model server size. Click on the checkbox Make deployed available via an external route.
Once the model server is configured, users need to enable GPUs. Go to the OpenShift console, open the servingRuntime instance in the namespace corresponding to the data science project and edit the yaml with the following parameters. Note that users need to add the appropriate number of GPUs as per their environment.
      resources:
        limits:
          cpu: '2'
          memory: 8Gi
          nvidia.com/gpu: '1'
        requests:
          cpu: '1'
          memory: 4Gi
          nvidia.com/gpu: '1'
Deploy Model
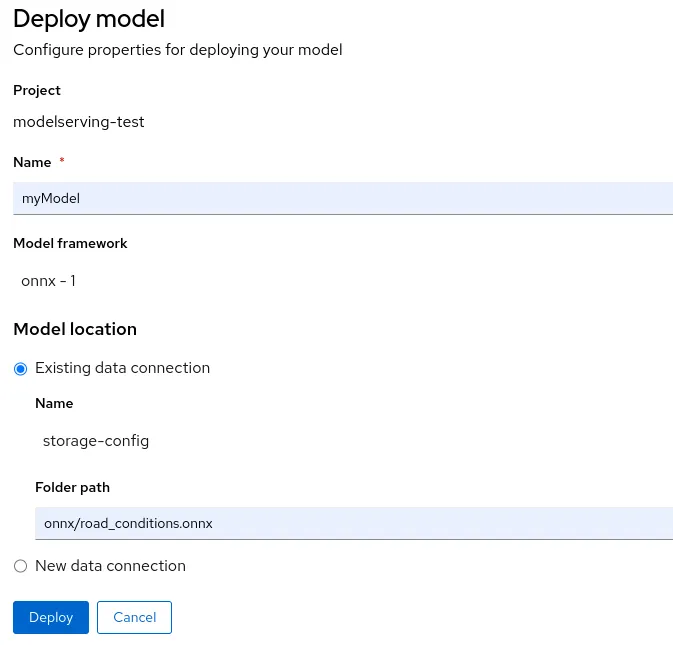
Click on Models and model servers -> Deploy model. Enter values for the properties as follows.
Model Inference via REST API
- Click on Deployed models to get the inference endpoint
- Use the following command to get predictions on sample data
curl -k <Inference-endpoint> -d '{"inputs": [{ "name": "dense_input", "shape": [1, 7], "datatype": "FP64", "data": [[0.36, 0.20, 9.79, 0.009, -0.13, -0.02, 0.14]]}]}'
Monitoring the Model
- Enable monitoring for user defined projects as listed here.
- Login to the cluster via OpenShift CLI (oc command).
- Run the command oc new-project grafana
- Navigate to Openshift-console --> Projects --> Grafana
- Click the + button on the top right to add the following yaml
- Navigate to OperatorHub --> Install Grafana Operator
- Create the grafana instance under "Installed Operators --> Grafana Operator --> Grafana --> Create Grafana --> YAML View" and paste the following yaml
- Run the following command
oc adm policy add-cluster-role-to-user cluster-monitoring-view -z grafana-serviceaccount
- Run the following command and save/paste the token for future use.
oc serviceaccounts get-token grafana-serviceaccount -n grafana
- Create grafana datasource under: "Installed Operators --> Grafana Operator --> Grafana --> Create Grafana DataSource --> YAML View" and paste this yaml
- Edit the yaml on line 18 to paste the <token> from previous step
- Run the following command
oc port-forward svc/grafana-service 3000:3000
- In the browser --> Navigate to localhost:3000 --> Login with root/secret
- In the left hand panel, navigate to Dashboards --> Manage --> Import and paste the following json
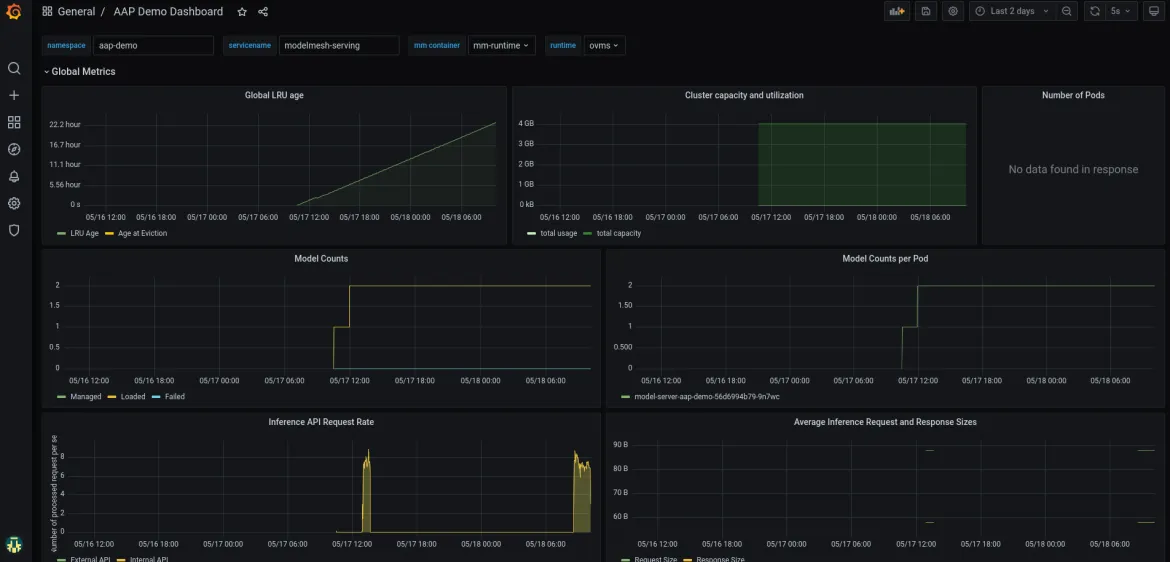
- Open the dashboard in the grafana UI and enter values for the following parameters on top of the dashboard
- Namespace: namespace where the model server resides
- Service Name: modelmesh-serving
- Container: mm
- Runtime : type of runtime deployed
View the metrics as seen below.
Summary
In this article, we showed Red Hat OpenShift Data Science features for serving multiple model formats with GPUs enabled as well as capturing model metrics through Prometheus. Following the steps in this article, users can now easily manage their data science projects, scale their model serving as well as monitor the deployed models. We highly encourage users to try out the new features in Red Hat OpenShift Data Science. For more information, please visit the Red Hat OpenShift Data Science developer portal here. Or dive directly into the model serving learning path on the developer portal here.
저자 소개
채널별 검색
오토메이션
기술, 팀, 인프라를 위한 IT 자동화 최신 동향
인공지능
고객이 어디서나 AI 워크로드를 실행할 수 있도록 지원하는 플랫폼 업데이트
오픈 하이브리드 클라우드
하이브리드 클라우드로 더욱 유연한 미래를 구축하는 방법을 알아보세요
보안
환경과 기술 전반에 걸쳐 리스크를 감소하는 방법에 대한 최신 정보
엣지 컴퓨팅
엣지에서의 운영을 단순화하는 플랫폼 업데이트
인프라
세계적으로 인정받은 기업용 Linux 플랫폼에 대한 최신 정보
애플리케이션
복잡한 애플리케이션에 대한 솔루션 더 보기
오리지널 쇼
엔터프라이즈 기술 분야의 제작자와 리더가 전하는 흥미로운 스토리
제품
- Red Hat Enterprise Linux
- Red Hat OpenShift Enterprise
- Red Hat Ansible Automation Platform
- 클라우드 서비스
- 모든 제품 보기
툴
체험, 구매 & 영업
커뮤니케이션
Red Hat 소개
Red Hat은 Linux, 클라우드, 컨테이너, 쿠버네티스 등을 포함한 글로벌 엔터프라이즈 오픈소스 솔루션 공급업체입니다. Red Hat은 코어 데이터센터에서 네트워크 엣지에 이르기까지 다양한 플랫폼과 환경에서 기업의 업무 편의성을 높여 주는 강화된 기능의 솔루션을 제공합니다.

