
In the previous article in the Path to Distributed Tracing series, we discussed how leveraging some key capabilities brought by the service mesh can be a great first step toward modern observability. We also explained why it’s important to take into account context propagation, and how it can help us connect the dots when dealing with complex distributed systems. Now that you understand the theory, it's time for us to show you a real, step-by-step example.
We'll start by deploying a couple of simple client-server applications into aRed Hat OpenShift cluster. We'll show you what the service mesh can do for you with the help of Kiali. We'll demonstrate why context needs to be propagated, and then explore two complementary alternatives (manual header propagation and automatic instrumentation) to achieve it.
Propagating the context
Before installing a demo application in OpenShift, we deploy the requisite components by following the official instructions:
- Red Hat build of OpenTelemetry
- Distributed tracing platform (Tempo)
- Kiali Operator provided by Red Hat
- Red Hat OpenShift Service Mesh
Deploying example applications on OpenShift
First, we deploy the following applications, written in Python:
@app.route('/no-header-forwarding')
def no_forwarding():
  # Simulate some work
  sleep(0.1)
  response = requests.get('http://app2:9080')
  # Simulate some work
  sleep(0.1)
  return flask.Response(response.text)
This application is just a small server that listens to /no-header-forwarding endpoint. When receiving a request, it nests another request to app2 and, after receiving an answer, it responds to the first request.
The second application, called App2, is even simpler. It listens on / and responds with the string bye after 0.15 seconds.
@app.route('/')
def bye():
   # Simulate some work
   sleep(0.15)
   return flask.Response("bye")
To follow along and try this yourself, download the manifests for App1 and App2.
Add these apps into the mesh by adding the following deployment annotation under spec.template.metadata.annotations:
sidecar.istio.io/inject: "true"Once deployed, we can move to the fun part. Let’s observe!
First observations
After deploying our application into the OpenShift Service Mesh, it provides great observability information in the Kiali console. We're ready to send some simple curl requests to our application, so open the Kiali console to explore the different dashboards.
curl $(oc -n istio-system get route istio-ingressgateway -o jsonpath='{.spec.host}')/header-forwardingFirst, click on Graph in the left column to see the dependency graph.
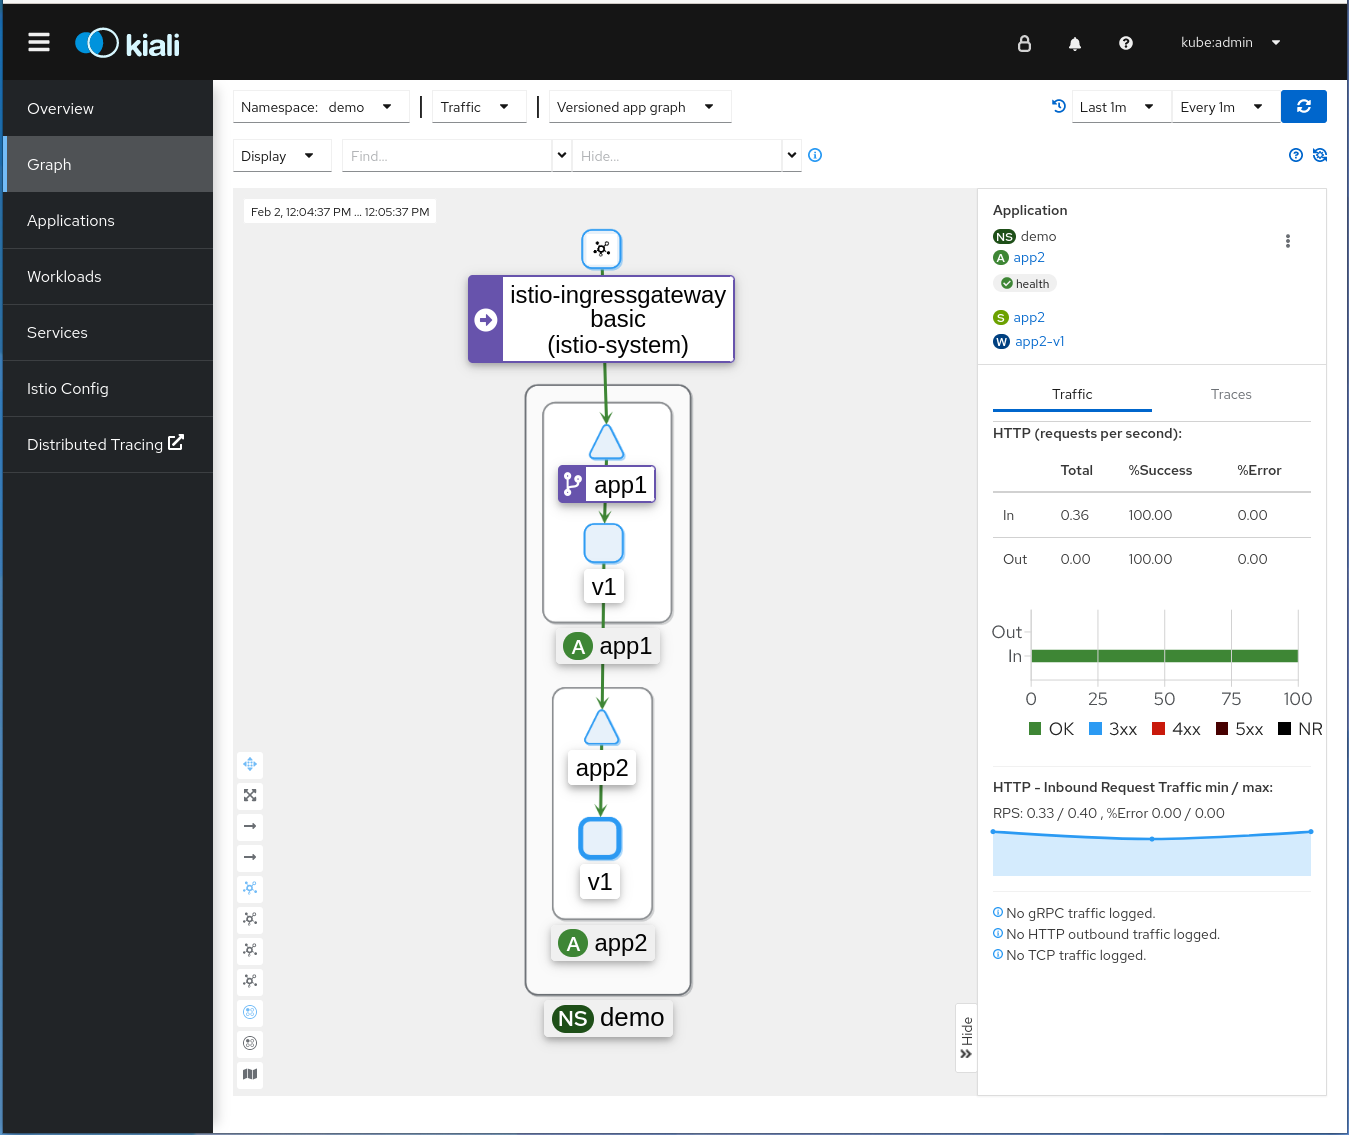
You can observe who’s talking to whom, and the green lines are telling you that the communication is successful! You also see traffic metrics with useful insights, including response codes.
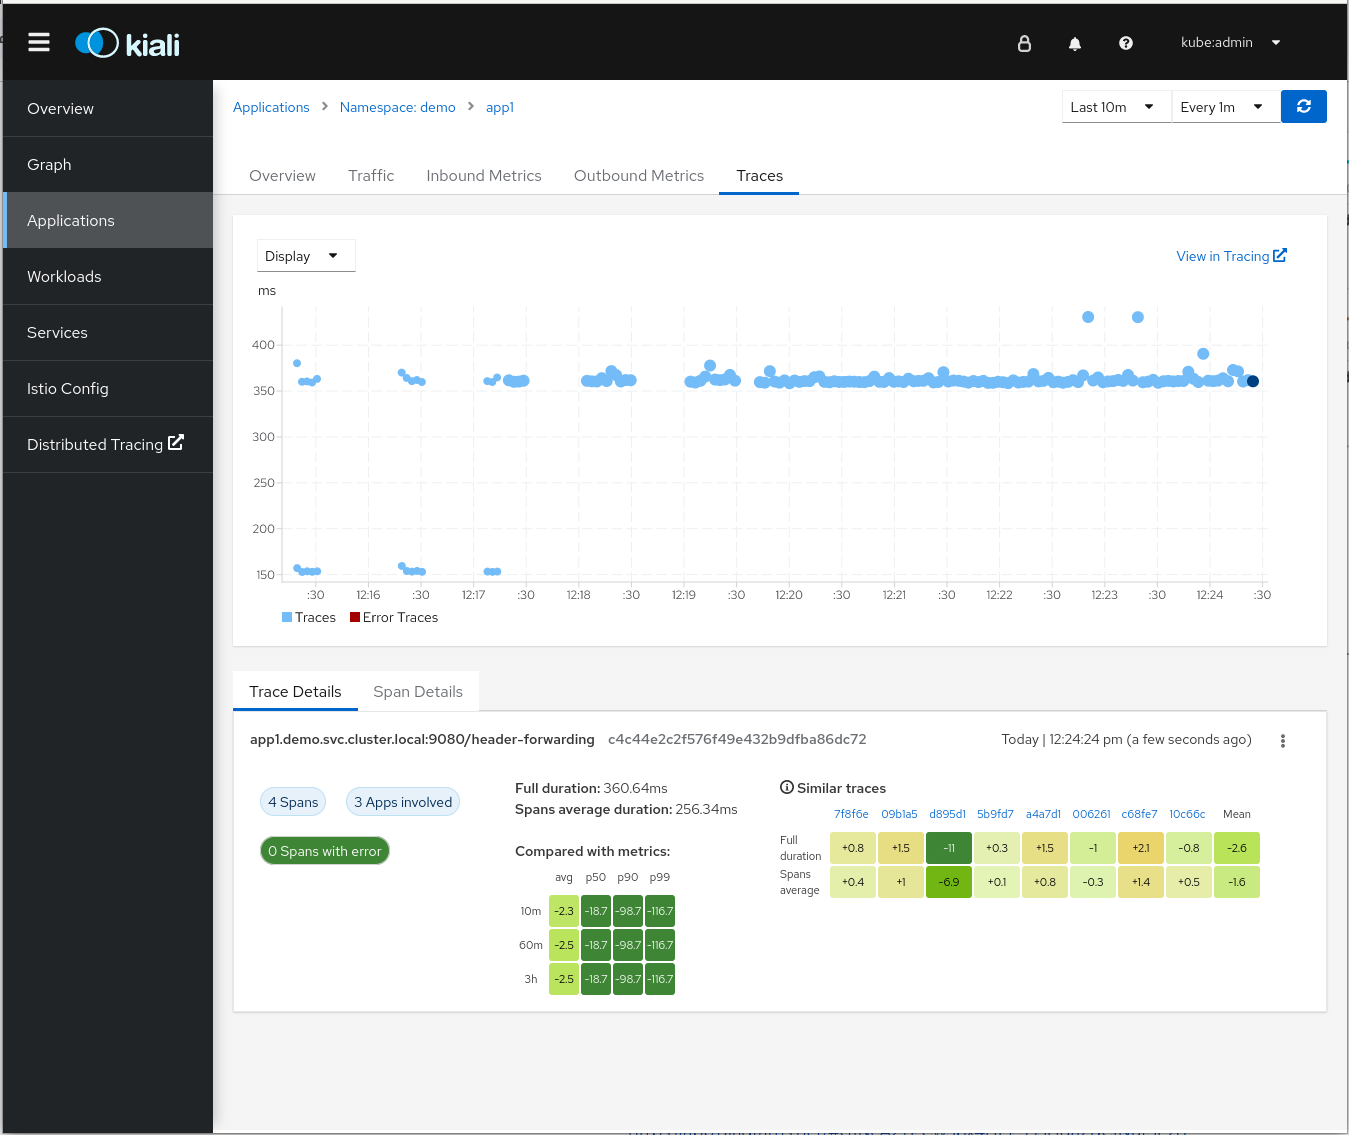
Now navigate to Applications and click on the Traces tab. One by one, information about the time spent in all your requests is shown:
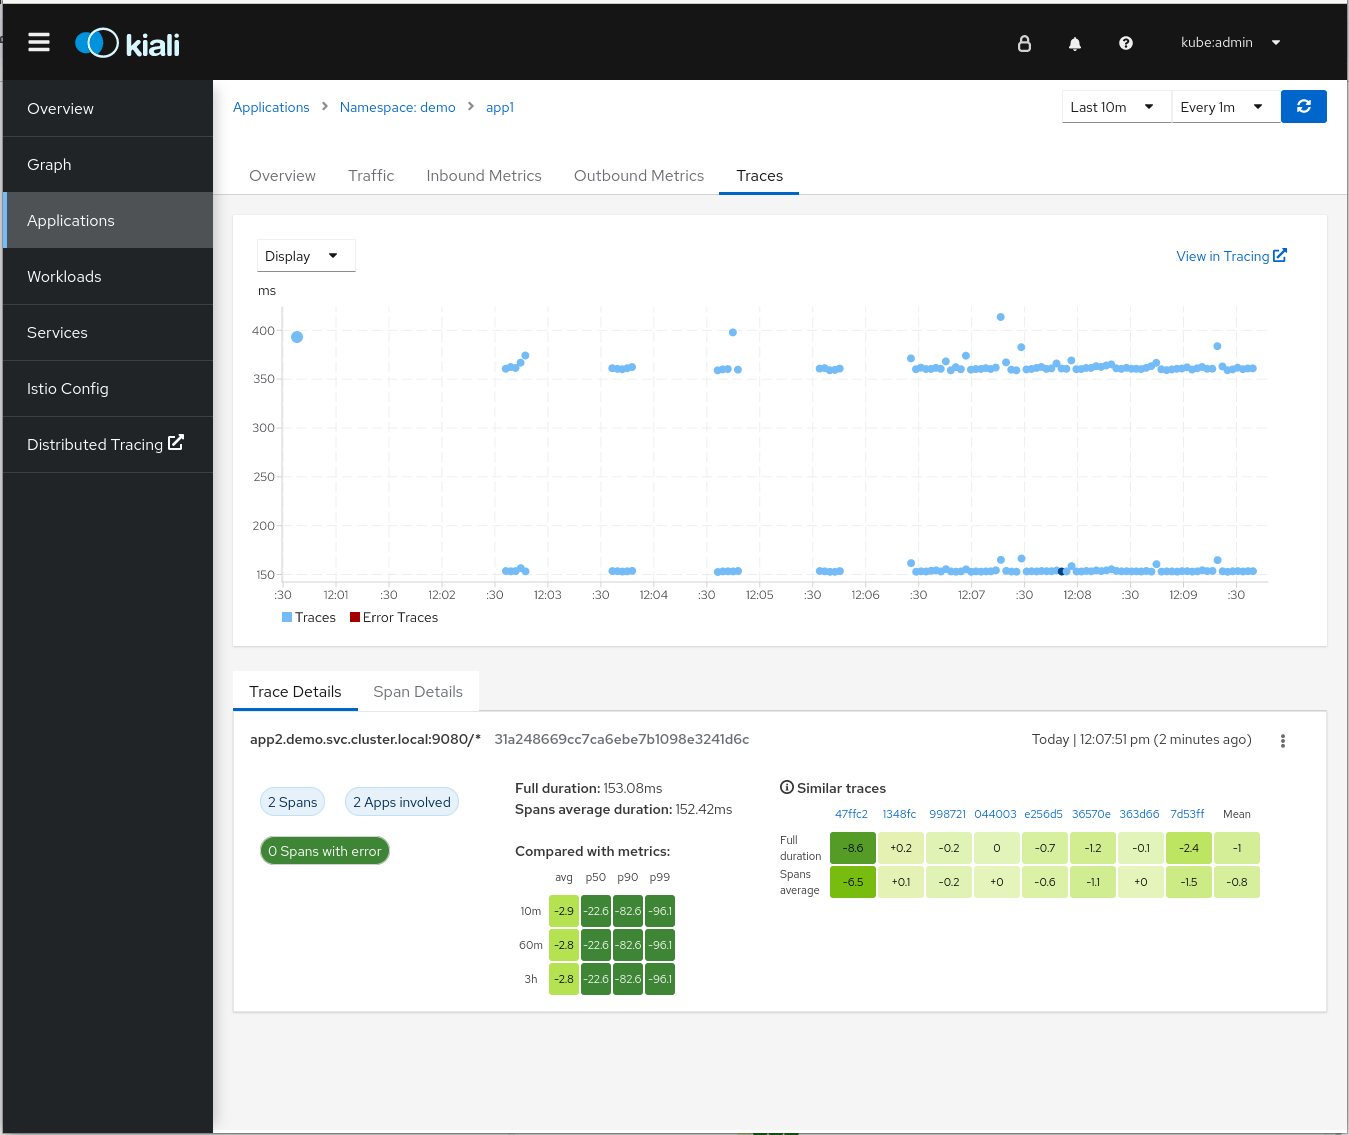
You can observe a scatter plot showing the time consumed by every request. This information is also aggregated and presented in a heatmap, which allows you to understand percentiles and comparisons between them. You can see that spans are separated into two “lines”, ones that take around 350ms and others 150ms. We'll analyze this later.
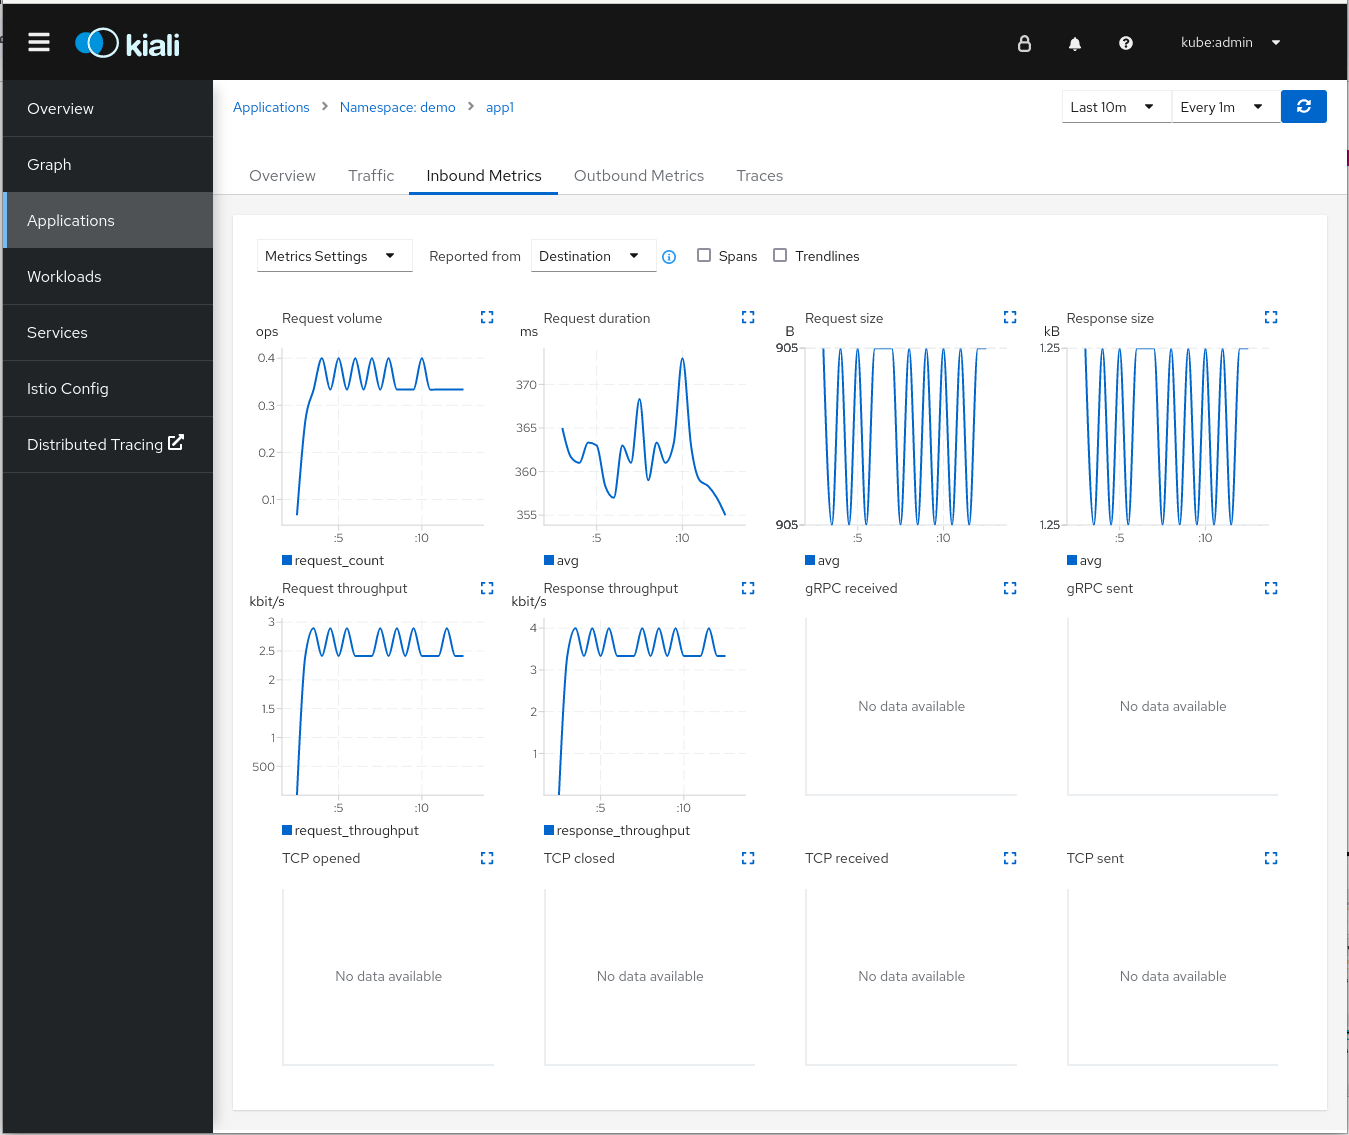
Inbound and Outbound metrics are also provided. This helps you have a better idea about how your application is performing, including data about request throughput, duration, sizes, and more. You get all this and you haven’t touched the application yet!
As we explained in our previous article, even though OpenShift Service Mesh and Envoy automate much of the process, a small change is still needed in the application code to observe a full transaction in a distributed system. You must at least propagate the tracing headers to other services.
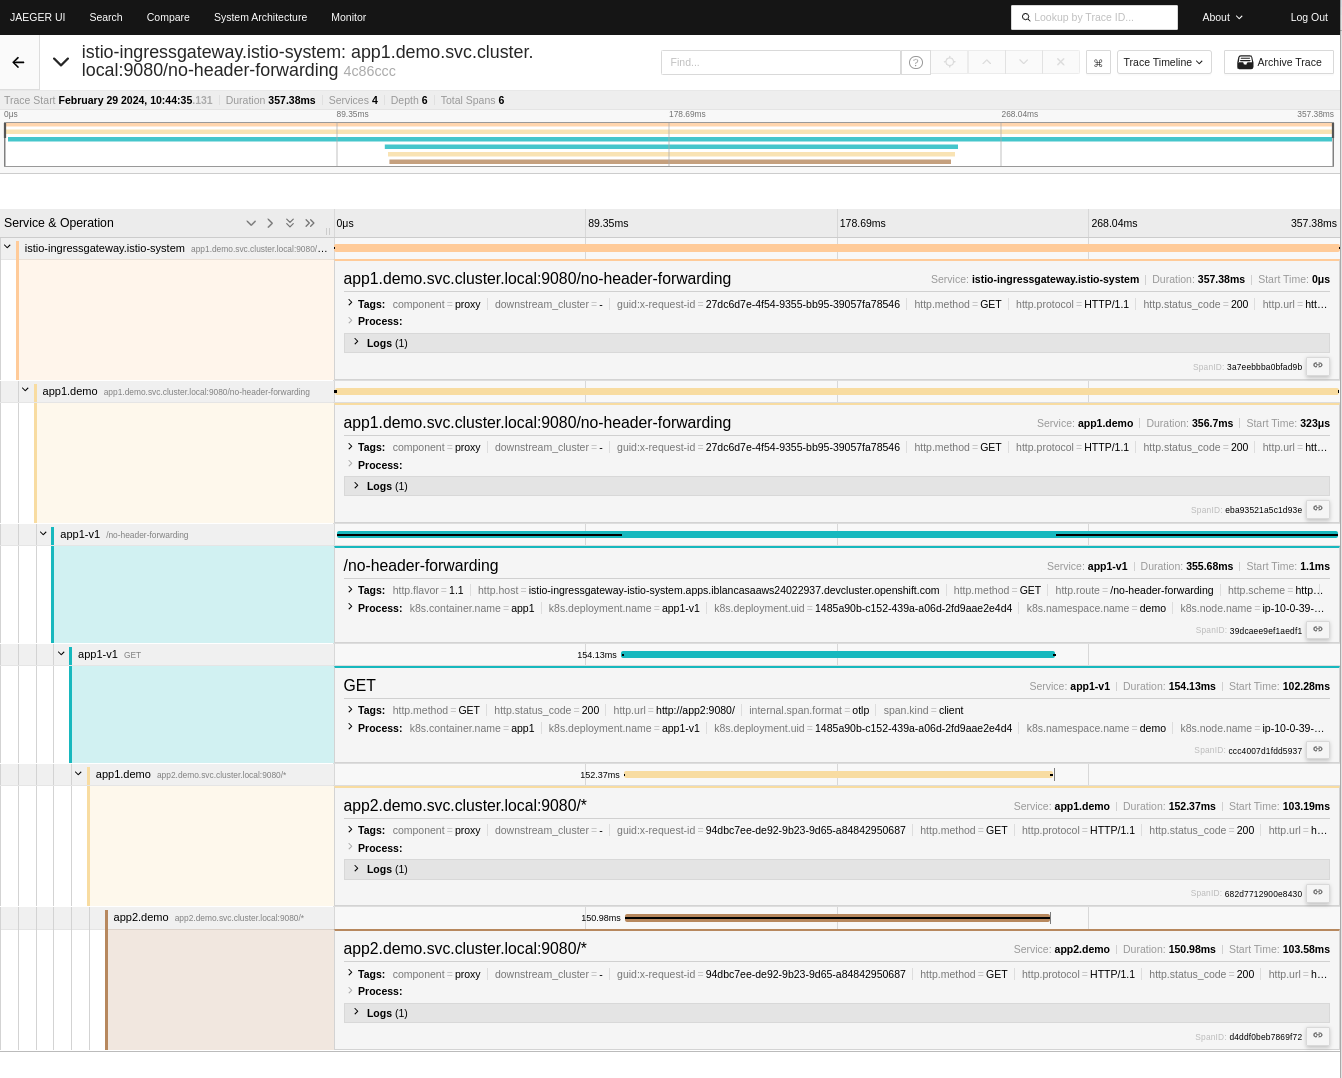
The Traces view in Kiali graph above reveals that the traces are divided into two lines. Let’s try to find out why.
To do that, open the user interface (UI) for Jaeger by clicking on the View in Tracing link in the top right corner of the Traces view in Kiali. This user interface is made available by the Tempo operator, and constitutes the tracing UI in OpenShift.
By exploring traces in the Jaeger UI, you can see that our distributed trace only contains two spans. The first one is injected by the mesh, and the second one comes from the application. The context is not further propagated between app1 and app2.
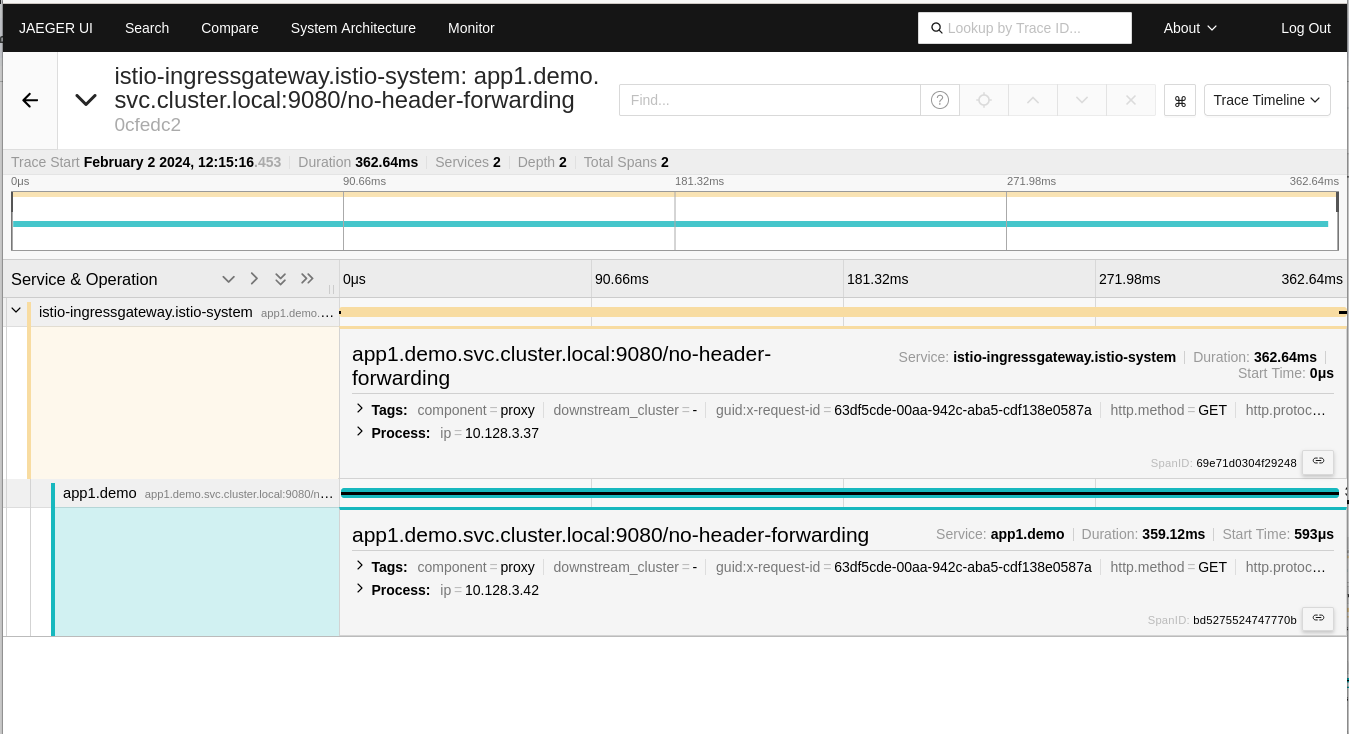
Now it’s clear that the service mesh can't do this part by itself. It doesn't understand the service's logic and can't link incoming and outgoing requests magically. This change, while minor in this simple demo app, must be manually added to every part of the code, including when it propagates the request to subsequent services. Without this change, your traces look like what's been shown above, with important information (specifically about App2, in this example) missing.
Let’s fix this! In App1, we just need to extract some of the headers from the incoming request and inject them into the request sent to App2. Specifically, the required headers in our context propagation are the Envoy-generated request ID and the b3 trace headers.
def context_get_headers(headers):
   header_names = [
       'X-B3-Traceid',
       'X-B3-Spanid',
       'X-B3-Parentspanid',
       'X-B3-Sampled',
       'X-B3-flags',
       'X-Request-Id',
   ]
   trace_headers = {}
   for name in header_names:
       if name in headers:
           trace_headers[name] = headers[name]
   return trace_headers
@app.route('/header-forwarding')
def forwarding():
   # Capture headers from the incoming request
   headers = context_get_headers(dict(flask.request.headers))
   # Simulate some work
   sleep(0.1)
   response = requests.get('http://app2:9080', headers=headers)
   # Simulate some work
   sleep(0.1)
   return flask.Response(response.text)
Pro tip: Forward only the required headers. Propagating everything received can lead to unexpected behavior. For example, if you forward the Host header, OpenShift Service Mesh will route the request again, causing an infinite loop.
Now that we've instrumented our application to propagate context, we can see all the players involved in a nice distributed trace with all the context ready to be debugged:
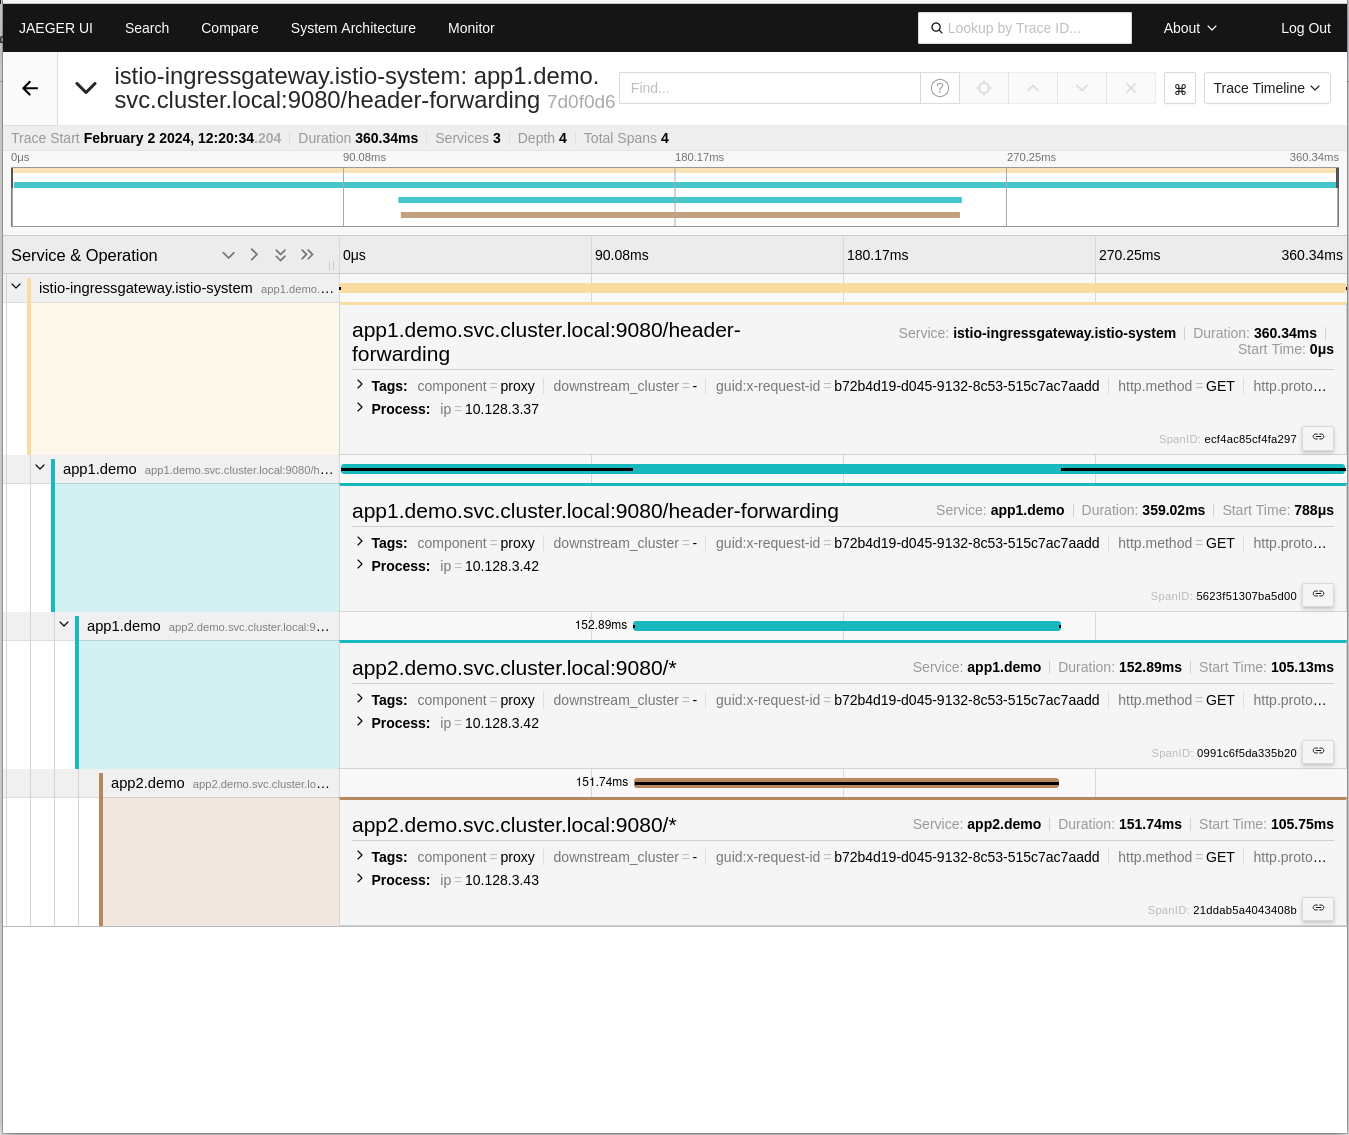
Back in the Kiali console, you can see that once we've instrumented the code and repeated the experiment, the two sets of traces have converged into one. Everything is now tied together.
Auto-instrumenting
So far, we've done this the "hard way" by manually instrumenting the code to propagate context. As you can tell, it's not actually that scary. Truth to be told though, there's yet an easier way. You can do all of this without touching a line of your application's code! Using the OpenTelemetry Operator, you can instrument code automatically. With this feature, you can forward the necessary headers for context propagation. To show you how, we need to create an Instrumentation object:
apiVersion: opentelemetry.io/v1alpha1
kind: Instrumentation
metadata:
 name: python
 namespace: demo
spec:
 exporter:
   # Python autoinstrumentation uses http/proto by default
   # so data must be sent to 4318 instead of 4317.
   endpoint: http://jaeger-collector.istio-system.svc.cluster.local:4318
 propagators:
   - tracecontext
   - baggage
   - b3multi
 sampler:
   type: parentbased_traceidratio
   argument: "1"
 resource:
   addK8sUIDAttributes: true
Most significantly, keep these components in mind:
- The endpoint: Point to the HTTP receiver
- The propagators used to propagate the needed HTTP headers
- The sampler
For more information, read the OpenTelemetry official documentation.
Finally, we add the annotation to the app1 deployment:
instrumentation.opentelemetry.io/inject-python: "true"This annotation injects the instrumentation into your deployment. This means that an init container is executed while your pods are being created. It copies the autoinstrumentation libraries to a volume accessible by your application, and injects some environment variables to ensure those libraries are loaded before the ones in your application.
Now our trace has more spans than before. The libraries injected into our application don't just forward the necessary headers for context propagation, they also add extra spans for the instrumented operations. For example, for therequests library, the get method is instrumented and one new span is created. The same happens for the Flaskmethods.
What next?
If this is so great, why didn't we start by just automagically instrumenting the code from the beginning? It’s because the ultimate goal of observability is understanding our own software to better react to failures that will always happen. Instrumenting the code is crucial, but be mindful of the challenges it entails.
Producing too much data can impact the storage capacity and computing resources of your hardware, so there’s always a balance. As you've already noticed during this simple example, adding instrumentation automatically renders a lot of information. You need to decide whether you want to produce it and store it in all circumstances, or whether it’s better to fine tune its generation, sampling, storage, and retention.
Our recommendation is to start small, understand the added value, and then grow sustainably from there. We think you'll end up instrumenting a lot, and using these great tools, but we also believe in the great value of understanding what's happening.
Conclusion
In this article, we've transformed theory into action, and demonstrated how to put together a service mesh with Kiali and distributed tracing in OpenShift, using OpenTelemetry auto instrumentation. We explained how it can help your teams to focus on implementing and maintaining code while leveraging the OpenShift platform components.
Stay tuned! In the next article we discuss the pros and cons of each method, and in what situation each of them shine.
저자 소개

Jose is a Senior Product Manager at Red Hat OpenShift, with a focus on Observability and Sustainability. His work is deeply related to manage the OpenTelemetry, distributed tracing and power monitoring products in Red Hat OpenShift.
His expertise has been built from previous gigs as a Software Architect, Tech Lead and Product Owner in the telecommunications industry, all the way from the software programming trenches where agile ways of working, a sound CI platform, best testing practices with observability at the center have presented themselves as the main principles that drive every modern successful project.
With a heavy scientific background on physics and a PhD in Computational Materials Engineering, curiousity, openness and a pragmatic view are always expected. Beyond the boardroom, he is a C++ enthusiast and a creative force, contributing symphonic and electronic touches as a keyboardist in metal bands, when he is not playing videogames or lowering lap times at his simracing cockpit.

Israel is a Sofware Engineer at Red Hat OpenShift, with a focus on Observability, mainly on OpenTelemetry.
유사한 검색 결과
채널별 검색

오토메이션
기술, 팀, 인프라를 위한 IT 자동화 최신 동향

인공지능
고객이 어디서나 AI 워크로드를 실행할 수 있도록 지원하는 플랫폼 업데이트

오픈 하이브리드 클라우드
하이브리드 클라우드로 더욱 유연한 미래를 구축하는 방법을 알아보세요

보안
환경과 기술 전반에 걸쳐 리스크를 감소하는 방법에 대한 최신 정보

엣지 컴퓨팅
엣지에서의 운영을 단순화하는 플랫폼 업데이트

인프라
세계적으로 인정받은 기업용 Linux 플랫폼에 대한 최신 정보

애플리케이션
복잡한 애플리케이션에 대한 솔루션 더 보기

오리지널 쇼
엔터프라이즈 기술 분야의 제작자와 리더가 전하는 흥미로운 스토리
제품
- Red Hat Enterprise Linux
- Red Hat OpenShift Enterprise
- Red Hat Ansible Automation Platform
- 클라우드 서비스
- 모든 제품 보기
툴
체험, 구매 & 영업
커뮤니케이션
Red Hat 소개
Red Hat은 Linux, 클라우드, 컨테이너, 쿠버네티스 등을 포함한 글로벌 엔터프라이즈 오픈소스 솔루션 공급업체입니다. Red Hat은 코어 데이터센터에서 네트워크 엣지에 이르기까지 다양한 플랫폼과 환경에서 기업의 업무 편의성을 높여 주는 강화된 기능의 솔루션을 제공합니다.