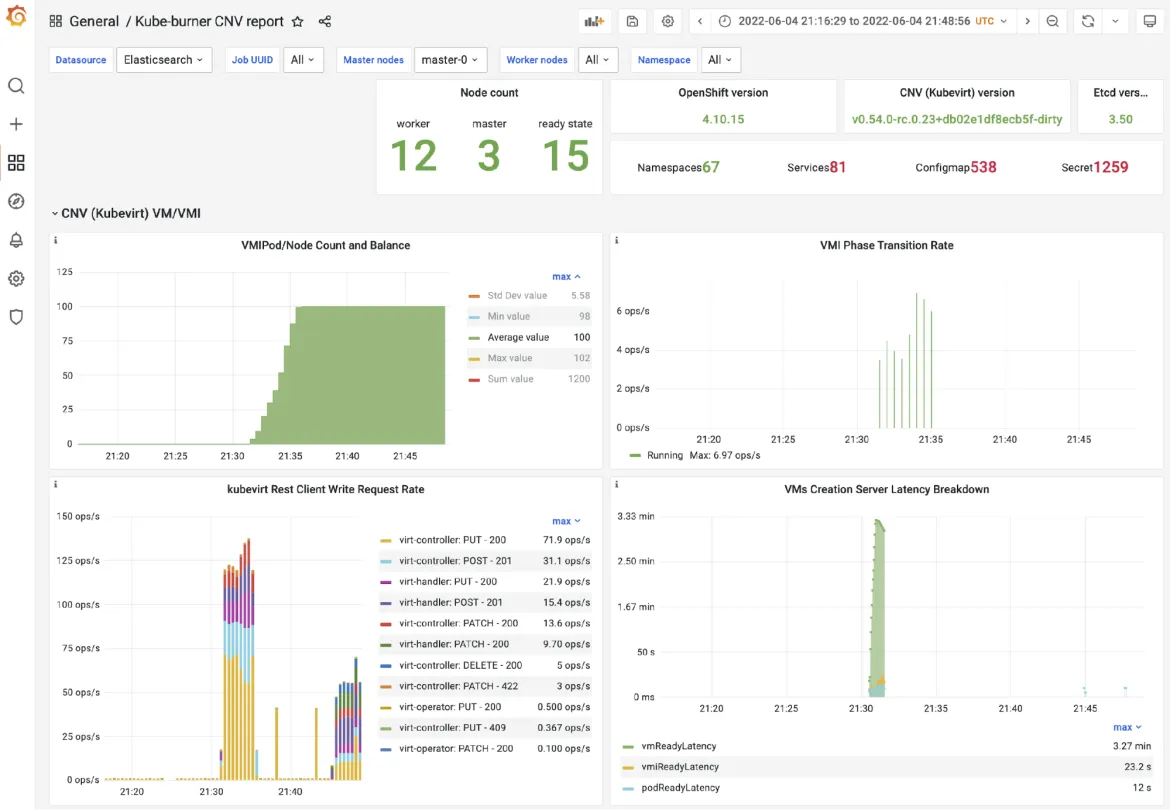
This blog post is dedicated to explaining the tool used by the OpenShift Performance and Scale team (Performance and Scalability) to test the performance and scalability of OpenShift CNV and plain KubeVirt.
Wait, what are OpenShift CNV and KubeVirt?
KubeVirt is a virtual machine management add-on for Kubernetes intended to allow users to run VMs alongside containers in their Kubernetes cluster. Through the use of Custom Resource Definitions (CRDs) and other Kubernetes features, KubeVirt seamlessly extends existing Kubernetes. OpenShift Virtualization is an add-on to OpenShift Container Platform that is built on top of KubeVirt.
The two most important CRDs are the VirtualMachine (VM) and the VirtualMachineInstance (VMI). The VM object behaves in a way that is familiar to users who have managed virtual machines on AWS, GCE, OpenStack, IBM Cloud, etc. Users can shut down a VM and then choose to start that same VM again at a later time. In many ways a VM is very similar to a Kubernetes StatefulSet. A VM is layered on top of a VMI, which is the lowest-level unit at the bottom of the KubeVirt stack. A VMI defines all the properties of the virtual machine, such as CPU type, amount of RAM and vCPUs, etc.
Why use kube-burner?
Kube-burner is a tool officially designed and used to stress different components of OpenShift, coordinating the creation and deletion of k8s resources. While kube-burner is designed to be compatible with vanilla Kubernetes and OpenShift, by default (as expected) there is no support for third-party add-ons such as KubeVirt's custom resource definitions (CRDs).
Therefore, we extended the kube-burner to support KubeVirt CRDs, enabling cluster benchmarking by creating VMs alongside pods.
A previous blog post has already delved into how kube-burner works, so in this blog we will provide a high-level introduction and focus on the extensions that allow you to create VMs.
How does a kube-burner work?
Kube-burner is configured by YAML configuration files, where these files describe the different actions to be performed on the cluster, such as deleting or creating objects, as well as collecting Prometheus metrics.
For example, a simple configuration file might look like this:
global:
  # collect metrics from Prometheus and dump to files
  writeToFile: true
  metricsDirectory: collected-metrics
  measurements:
  - name: vmLatency

jobs:
  # create the VMs
  - name: kubevirt-density
    jobType: create
    jobIterations: 1
    qps: 20
    burst: 20
    namespace: kubevirt-density
    # verify object count after running each job
    verifyObjects: true
    errorOnVerify: true
    # interval between jobs execution
    jobIterationDelay: 1s
    # wait all VMI be in the Ready Condition
    waitFor: ["VirtualMachine"]
    waitWhenFinished: true
    # timeout time after waiting for all object creation
    maxWaitTimeout: 1h
    jobPause: 10m
    # cleanup cleans previous execution (not deleted or failed)
    cleanup: true
    objects:

    - objectTemplate: templates/vm-ephemeral.yml
      replicas: 1
Creating or deleting thousands of objects
Using a benchmarking tool like kube-burner make it easy to create or delete thousands of objects defined in a configuration file.
Within kube-burner there is the concept of Query Per Second (QPS) and Burst, which define the object creation and deletion rate. VerifyObjects will fail the job if the desired number of replicas are not created in the cluster within the maxWaitTimeout interval. Cleanup is often important to delete objects created in the previous run if there is no intention to keep them in the test. Finally, the waiFor parameter defines a list of objects waiting to be in the Ready state, that is, they have been created and are running.
Since kube-burner allows users to pass variables to object models as inputVars parameters, we can define custom models for different VM objects. For example, we can use these resources to create the following model:
apiVersion: kubevirt.io/v1
kind: VirtualMachine
metadata:
  labels:
    kubevirt.io/os: {{.OS}}
  name: {{.name}}-{{.Replica}}
spec:
  running: {{.createVMI}}
  template:
    metadata:
      labels:
        kubevirt.io/os: {{.OS}}
    spec:
      domain:
        cpu:
          cores: {{.cpuCores}}
        devices:
          disks:
          - disk:
              bus: virtio
            name: cloudinitdisk
          - disk:
              bus: virtio
            name: containerdisk
        resources:
          requests:
            memory: {{.memory}}
      volumes:
      - containerDisk:
          image:  {{.image}}
          imagePullPolicy: IfNotPresent
        name: containerdisk
Where the previous configuration would be:
[...]
jobs:
[...]
    objects:
    - objectTemplate: templates/vm-ephemeral.yml
      replicas: 1
      inputVars:
        name: kubevirt-density
        image: quay.io/kubevirt/fedora-with-test-tooling-container-disk:v0.48.1
        OS: fedora27
        cpuCores: 1
        memory: 4G
        createVMI: true
Collecting Prometheus metrics
Kube-burner has a metrics collection mechanism that queries Prometheus and saves metrics to disk (in json files form) or indexes in external databases, currently ElasticSearch is the only supported one.
Prometheus queries are defined in a metric profile configuration file as shown below:
# Kubevirt metrics
- query: histogram_quantile(0.95, sum(rate(kubevirt_vmi_phase_transition_time_from_creation_seconds_bucket{}[5m])) by (phase, le))
  metricName: vmi95thCreationLatency

# Containers & pod metrics
- query: sum(irate(container_cpu_usage_seconds_total{name!=""}[2m]) * 100) by (pod, namespace, node)
  metricName: podCPU
To view these metrics, we can process Grafana to query the indexed metric in ElasticSearch or Prometheus.
Custom latency metrics
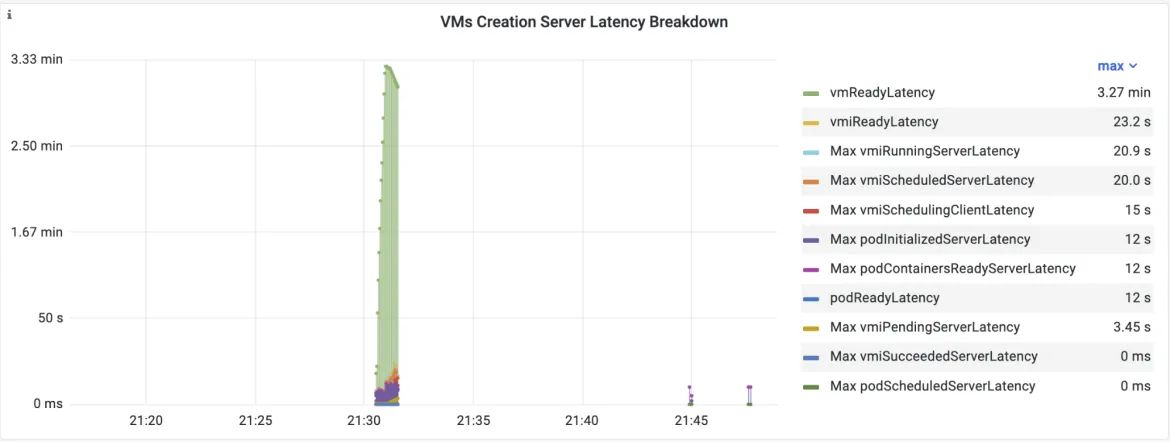
As kube-burner observes objects to check their states (for example, if a VM is in a Ready condition or if a VMI is in the execution phase), it is also possible to collect state transition latency from objects. As a curious factor, the implementation of such latency metrics in kune-burner for VMs inspired the implementation of similar metrics in the KubeVirt code.As shown earlier in the main configuration file, there is the measurement parameter which can be podLatency or vmLatency, where the names are self-explanatory. The vmLatency watches the VM, VMI, and pod objects and calculates state transition latency for all of them. Note that these latency metrics are not exported to Prometheus, but saved in json files or indexed in ElasticSearch.
For example, the vmLatency metric created by kube-burner is shown in the figure below:
Starting with kube-burner
Visit the github repository and check out a complete example configuration files (https://github.com/cloud-bulldozer/kube-burner). In addition to all of this, kube-kuber has other cool features like object verification and golang pprof collection.
Anyone interested in benchmarking a Kubernetes or OpenShift cluster by creating and deleting a large number of VMs can follow the steps listed in this blog and play with kube-burner to create node density tests.
You can also find a detailed kube-burner documentation in its readthedocs site.
Sobre o autor
Mais como este
Navegue por canal
Automação
Últimas novidades em automação de TI para empresas de tecnologia, equipes e ambientes
Inteligência artificial
Descubra as atualizações nas plataformas que proporcionam aos clientes executar suas cargas de trabalho de IA em qualquer ambiente
Nuvem híbrida aberta
Veja como construímos um futuro mais flexível com a nuvem híbrida
Segurança
Veja as últimas novidades sobre como reduzimos riscos em ambientes e tecnologias
Edge computing
Saiba quais são as atualizações nas plataformas que simplificam as operações na borda
Infraestrutura
Saiba o que há de mais recente na plataforma Linux empresarial líder mundial
Aplicações
Conheça nossas soluções desenvolvidas para ajudar você a superar os desafios mais complexos de aplicações
Programas originais
Veja as histórias divertidas de criadores e líderes em tecnologia empresarial
Produtos
- Red Hat Enterprise Linux
- Red Hat OpenShift
- Red Hat Ansible Automation Platform
- Red Hat Cloud Services
- Veja todos os produtos
Ferramentas
- Treinamento e certificação
- Minha conta
- Suporte ao cliente
- Recursos para desenvolvedores
- Encontre um parceiro
- Red Hat Ecosystem Catalog
- Calculadora de valor Red Hat
- Documentação
Experimente, compre, venda
Comunicação
- Contate o setor de vendas
- Fale com o Atendimento ao Cliente
- Contate o setor de treinamento
- Redes sociais
Sobre a Red Hat
A Red Hat é a líder mundial em soluções empresariais open source como Linux, nuvem, containers e Kubernetes. Fornecemos soluções robustas que facilitam o trabalho em diversas plataformas e ambientes, do datacenter principal até a borda da rede.
Selecione um idioma
Red Hat legal and privacy links
- Sobre a Red Hat
- Oportunidades de emprego
- Eventos
- Escritórios
- Fale com a Red Hat
- Blog da Red Hat
- Diversidade, equidade e inclusão
- Cool Stuff Store
- Red Hat Summit


