
The power of correlating observability signals
Observability is a complex landscape to navigate for organizations. Many different signals can be collected, such as metrics and logs, and traces are becoming increasingly relevant to track applications. Over the past few years, correlating observability signals has become one of the most helpful ways to deal with the increasing volume of observability data, minimizing the time and effort required to troubleshoot clusters effectively.
In this case, correlating observability signals means following relationships to find related data in multiple heterogeneous stores. Despite the power of such correlation tools, no open source project focusing on Kubernetes clusters had yet been made available. That is why Korrel8r was created. Red Hat founded the project in 2022 and it was first introduced in KubeCon Europe 2023. It is currently an alpha project of the Red Hat Observability organization.
Benefits of Korrel8r
Korrel8r is a correlation engine for observability signals and observable resources. It can correlate multiple domains, diverse signals, inconsistent labeling and varied data stores.
What are the project goals?
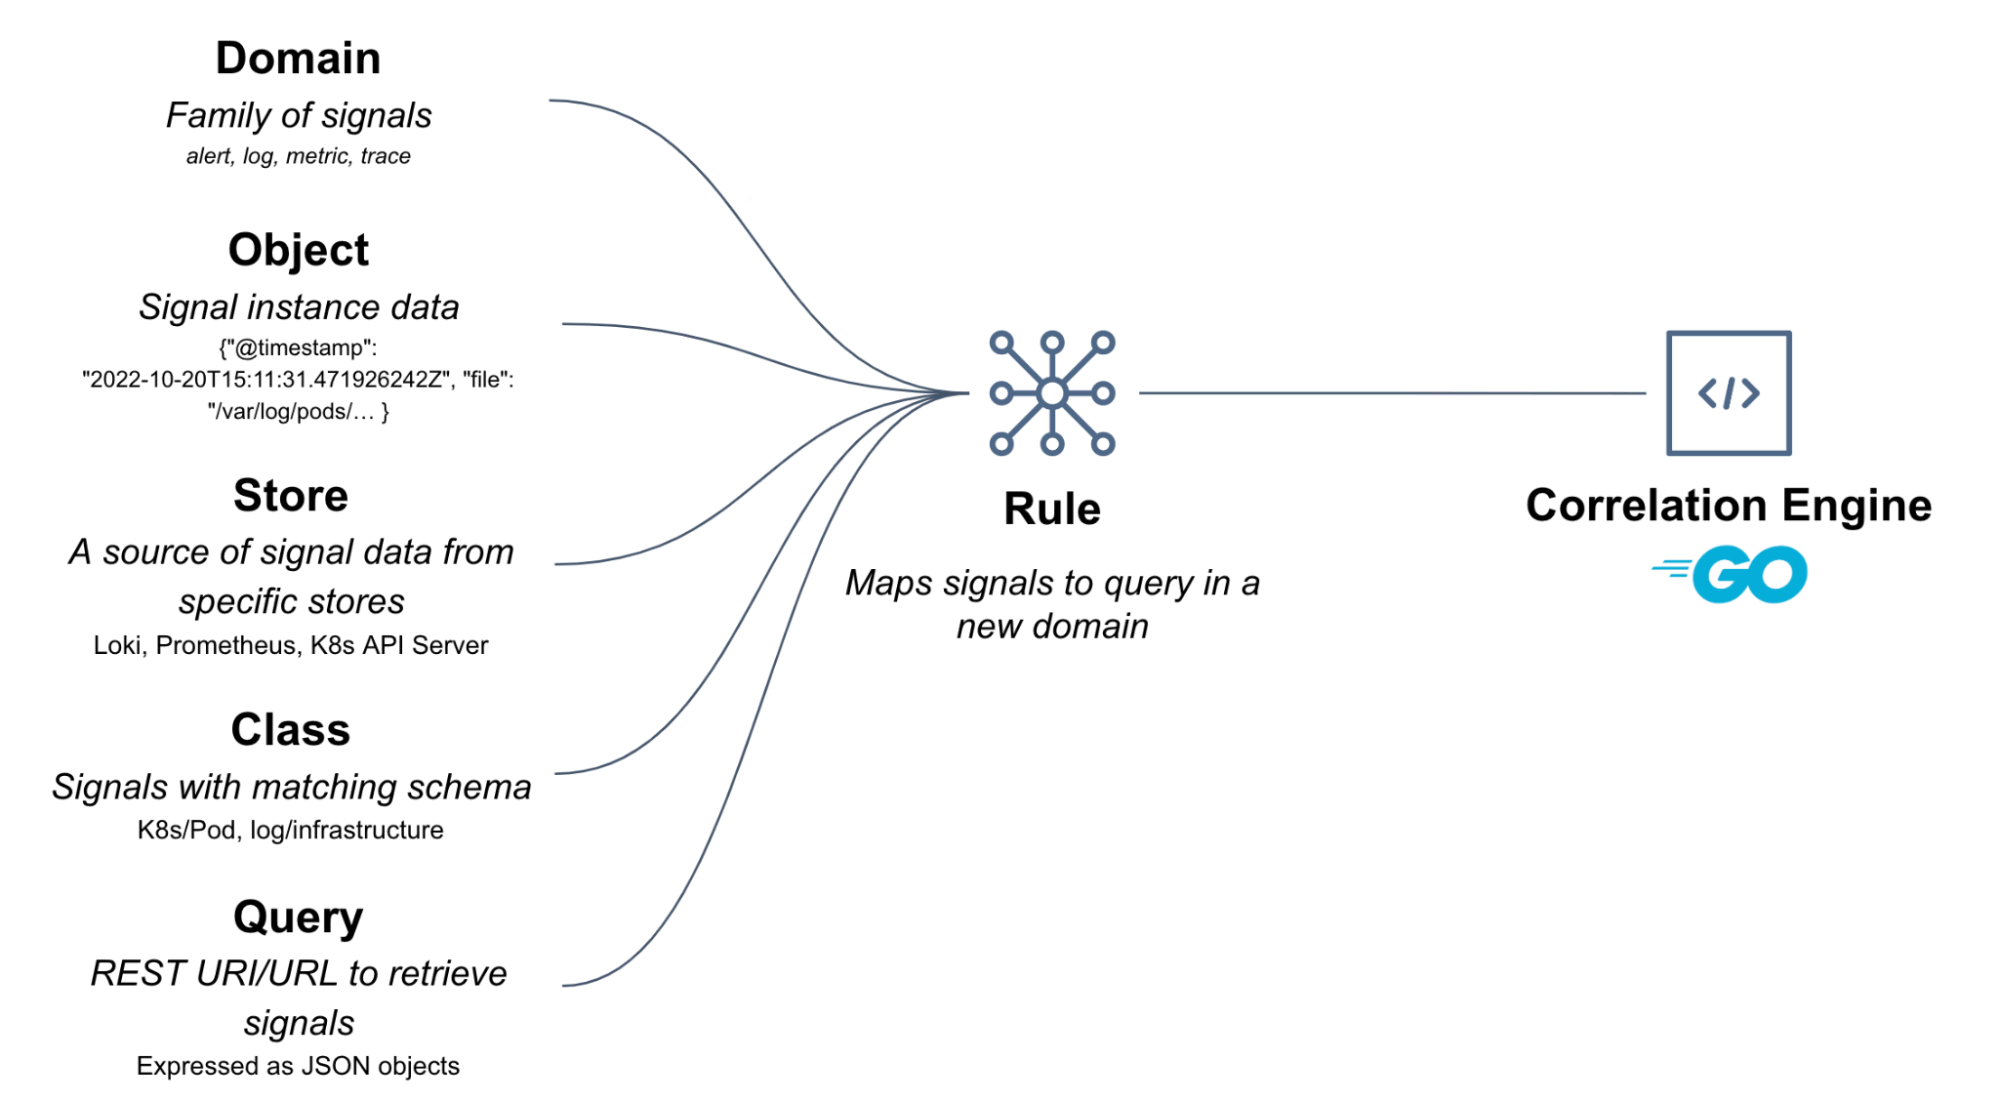
Korrel8r can encode domain knowledge from site reliability engineers (SREs) and other experts as re-usable rules. These rules can automate navigation across observability signals and help users' focus on the data they need to diagnose cluster problems and their root causes.
Korrel8r rules describe relationships between signals. Given a start signal (or object), such as an alert in a cluster, and a goal, like finding related logs to a specific alert, the engine searches for goal data (in this case, logs) that is related to the start signal (in this case, a given alert) by some chain of rules.
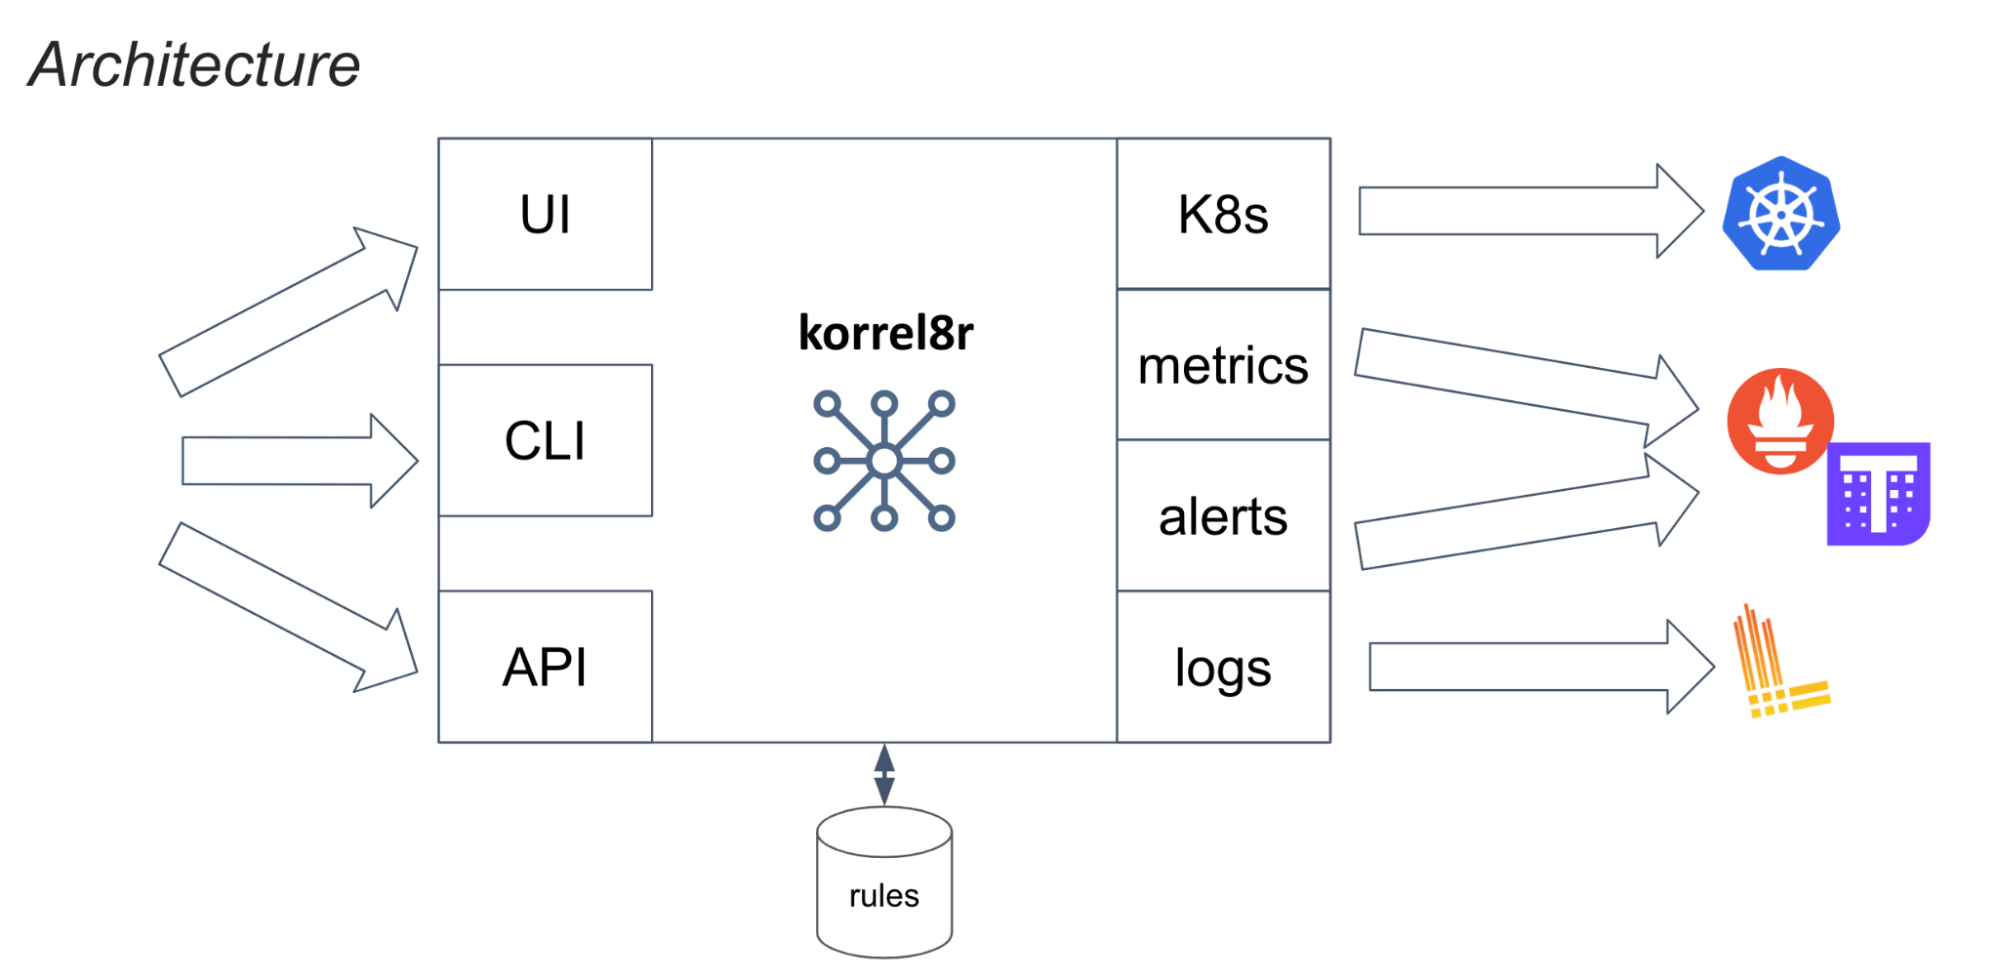
Korrel8r aims to connect data from different types of data stores—even those characterized by different schemas—to reduce manual steps and minimize cluster troubleshooting efforts. Currently, Korrel8r connects to data stores such as Loki for logs, Prometheus/Thanos for metrics and the kube-API server for cluster resources. View the following architecture diagram or read the Korrel8r documentation for more information.
By providing a REST API, Korrel8r aims to be useful in various contexts. In the first application, a cluster console displaying resource or signal information will query Korrel8r to discover related resources and signals that can be displayed to the user. Korrel8r is not tied to the Red Hat OpenShift web console; it is a generic service that accepts queries identifying starting objects (resources or signals) and returns queries for related goal objects, possibly in different stores from the starting point. This correlation-as-a-service will be useful in other tools that analyze cluster observability data.
Dev preview: Access a first correlation experience in the Red Hat OpenShift web console
As announced a few weeks ago in the What’s new in Red Hat OpenShift Monitoring 4.14, Logging 5.8, and Distributed Tracing 2.9? blog, a first correlation experience is now available to OpenShift users directly in the web console as part of the latest Logging 5.8 z-stream release. In OpenShift, Korrel8r is officially named observability signal correlation for Red Hat OpenShift.
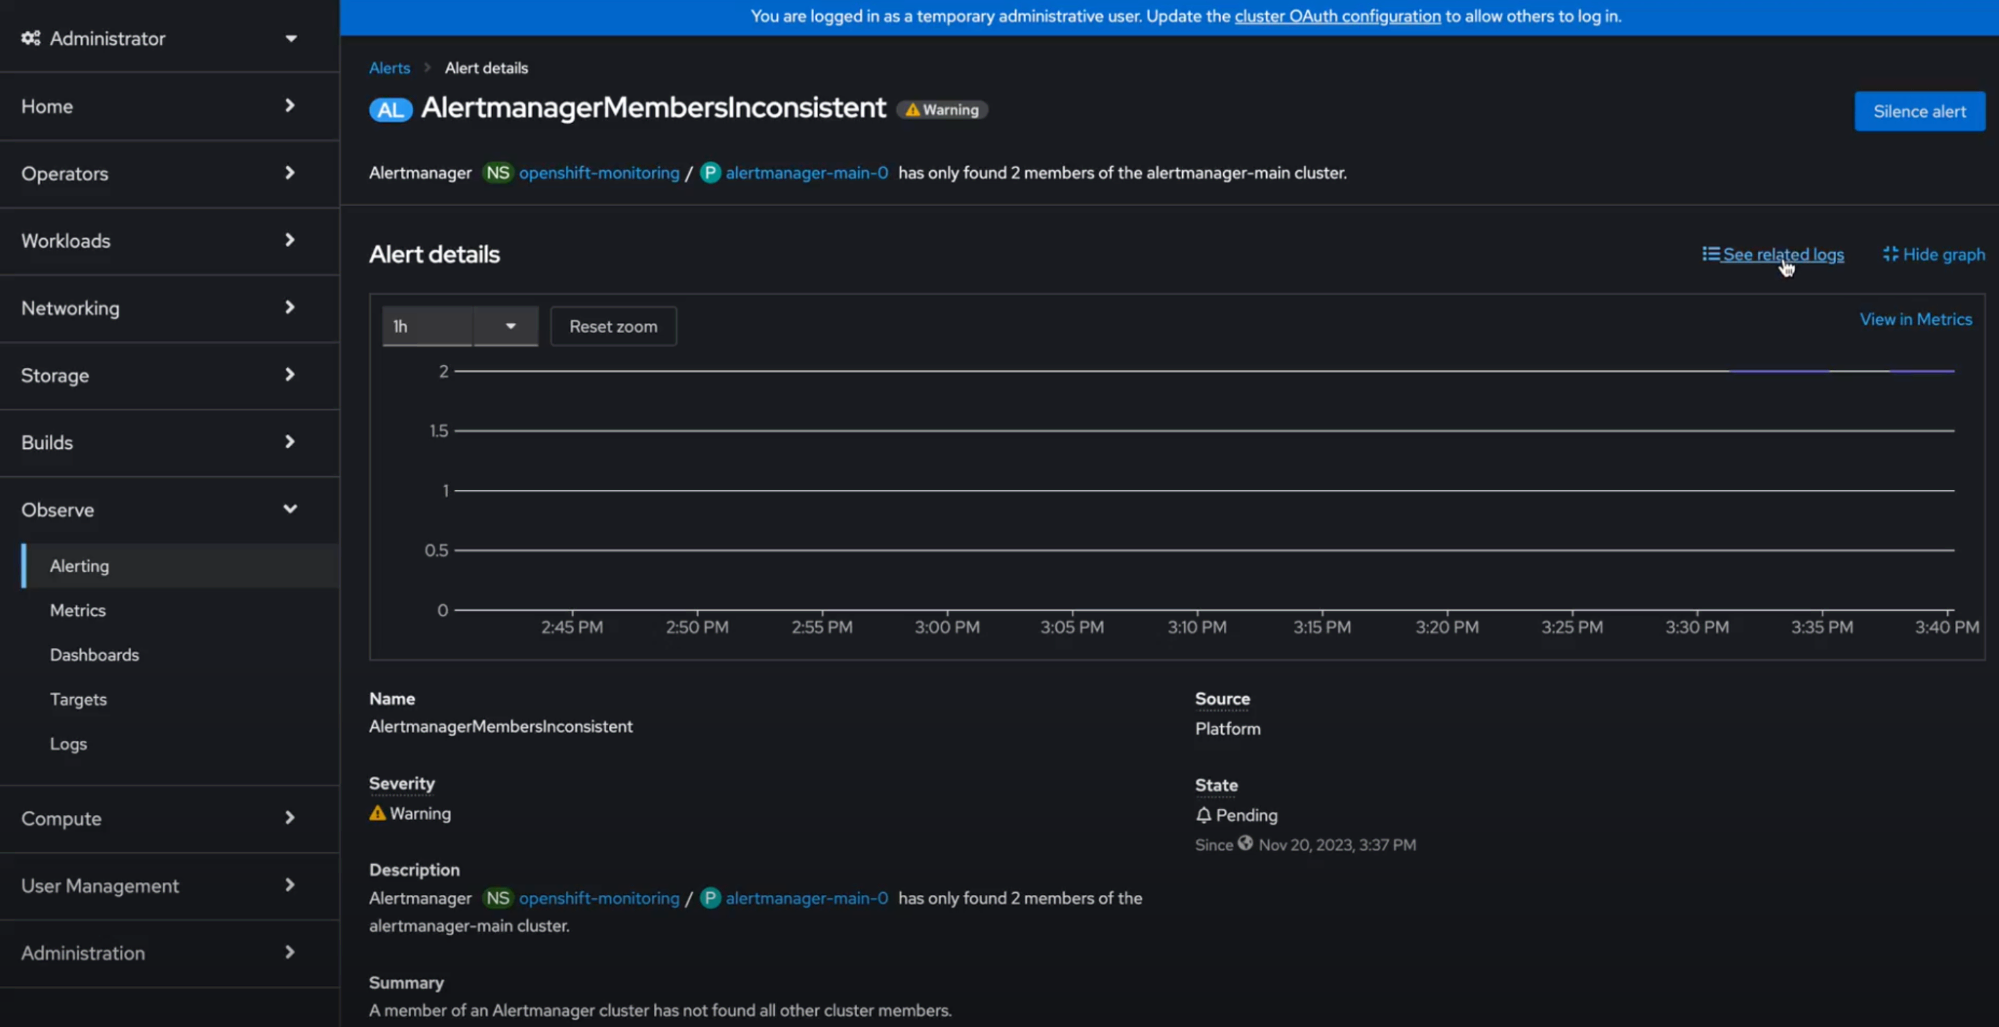
Korrel8r is available in the OpenShift web console if the Logs exploration UI is enabled. This dev preview feature aims to help you troubleshoot issues related to OpenShift clusters faster by taking you from a specific alert to its relevant log and from a particular log to its relevant metrics through links. The following image shows how, by deep diving into the Alert details information (starting point: Observe > Alerting UI > Alerts), you can use a new link: See related logs. Note that the button is not shown if correlated data is not found.
Once you click the link, you are immediately directed to the Observe > Logs UI, providing the relevant log query. More information on accessing the Logging view in the OpenShift web console is provided here.
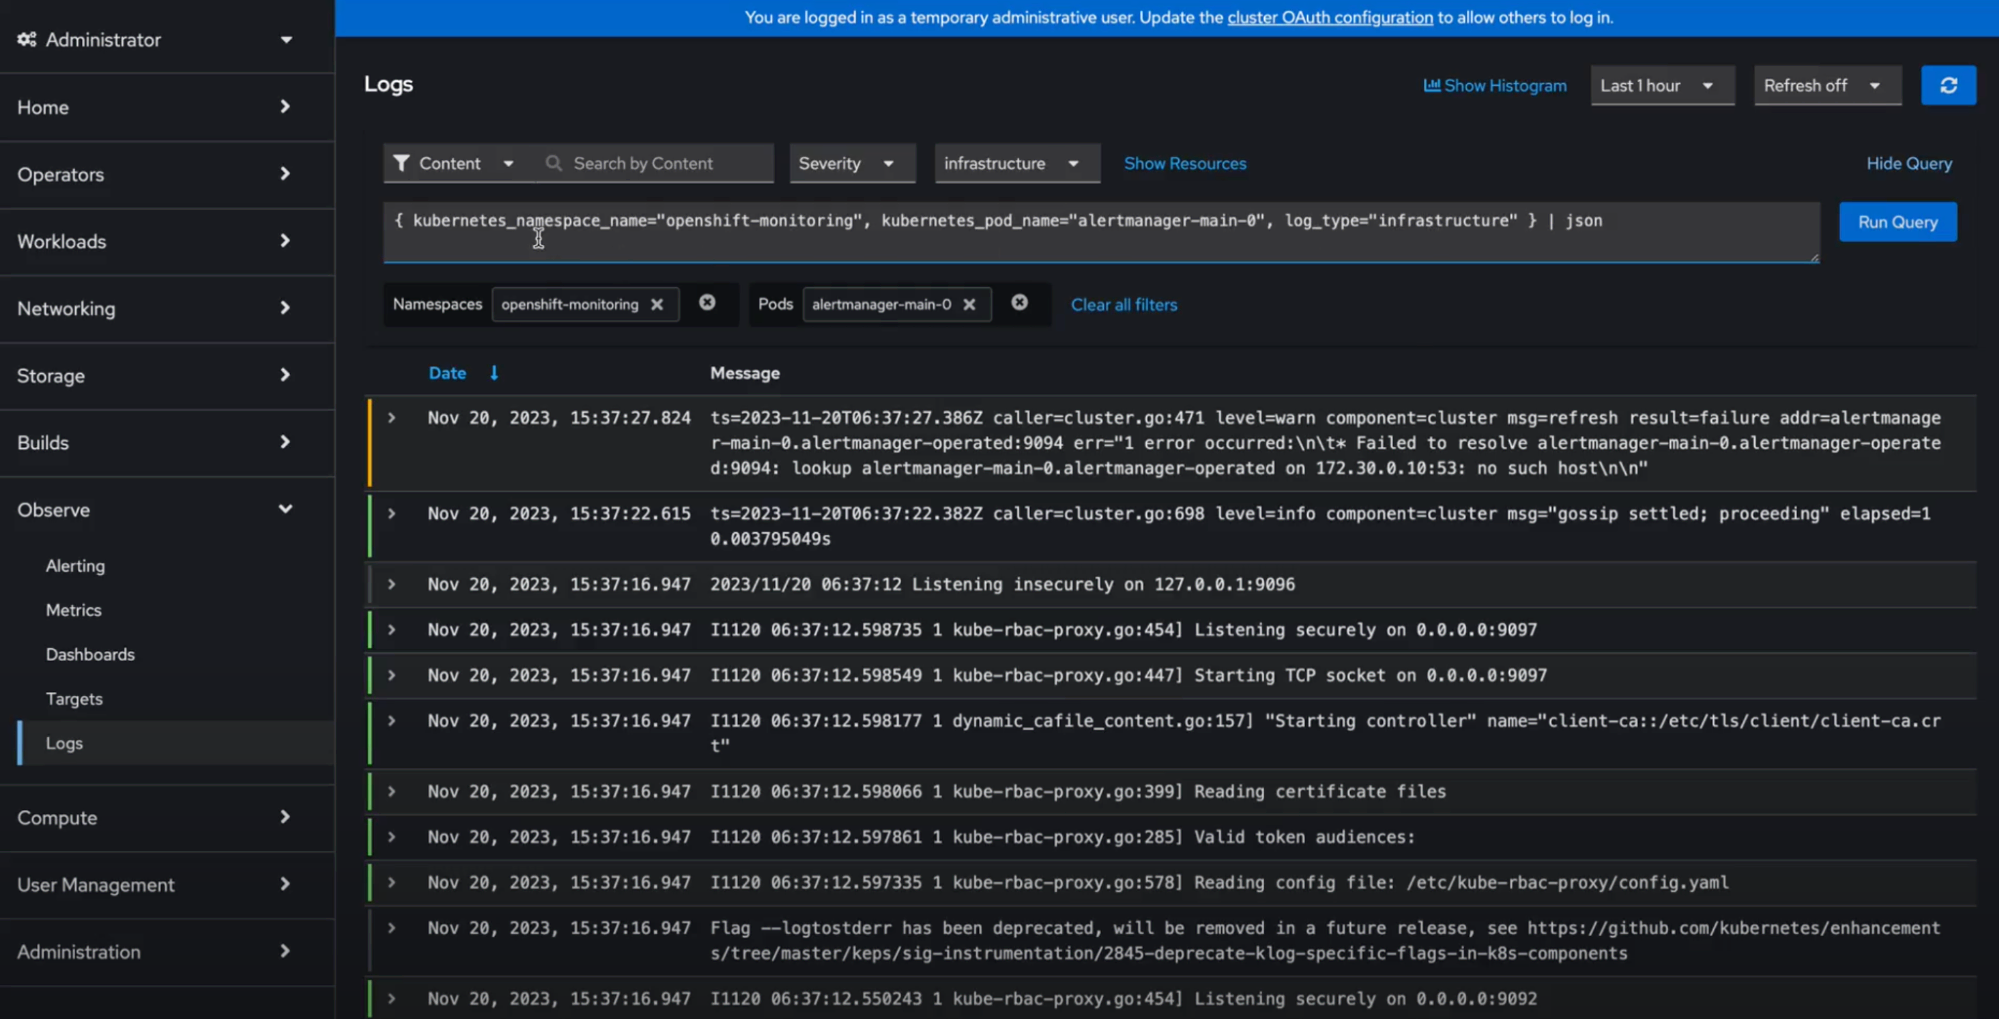
Similarly, once in the Logs UI, you can click on Metrics, which is provided in the Correlation column.
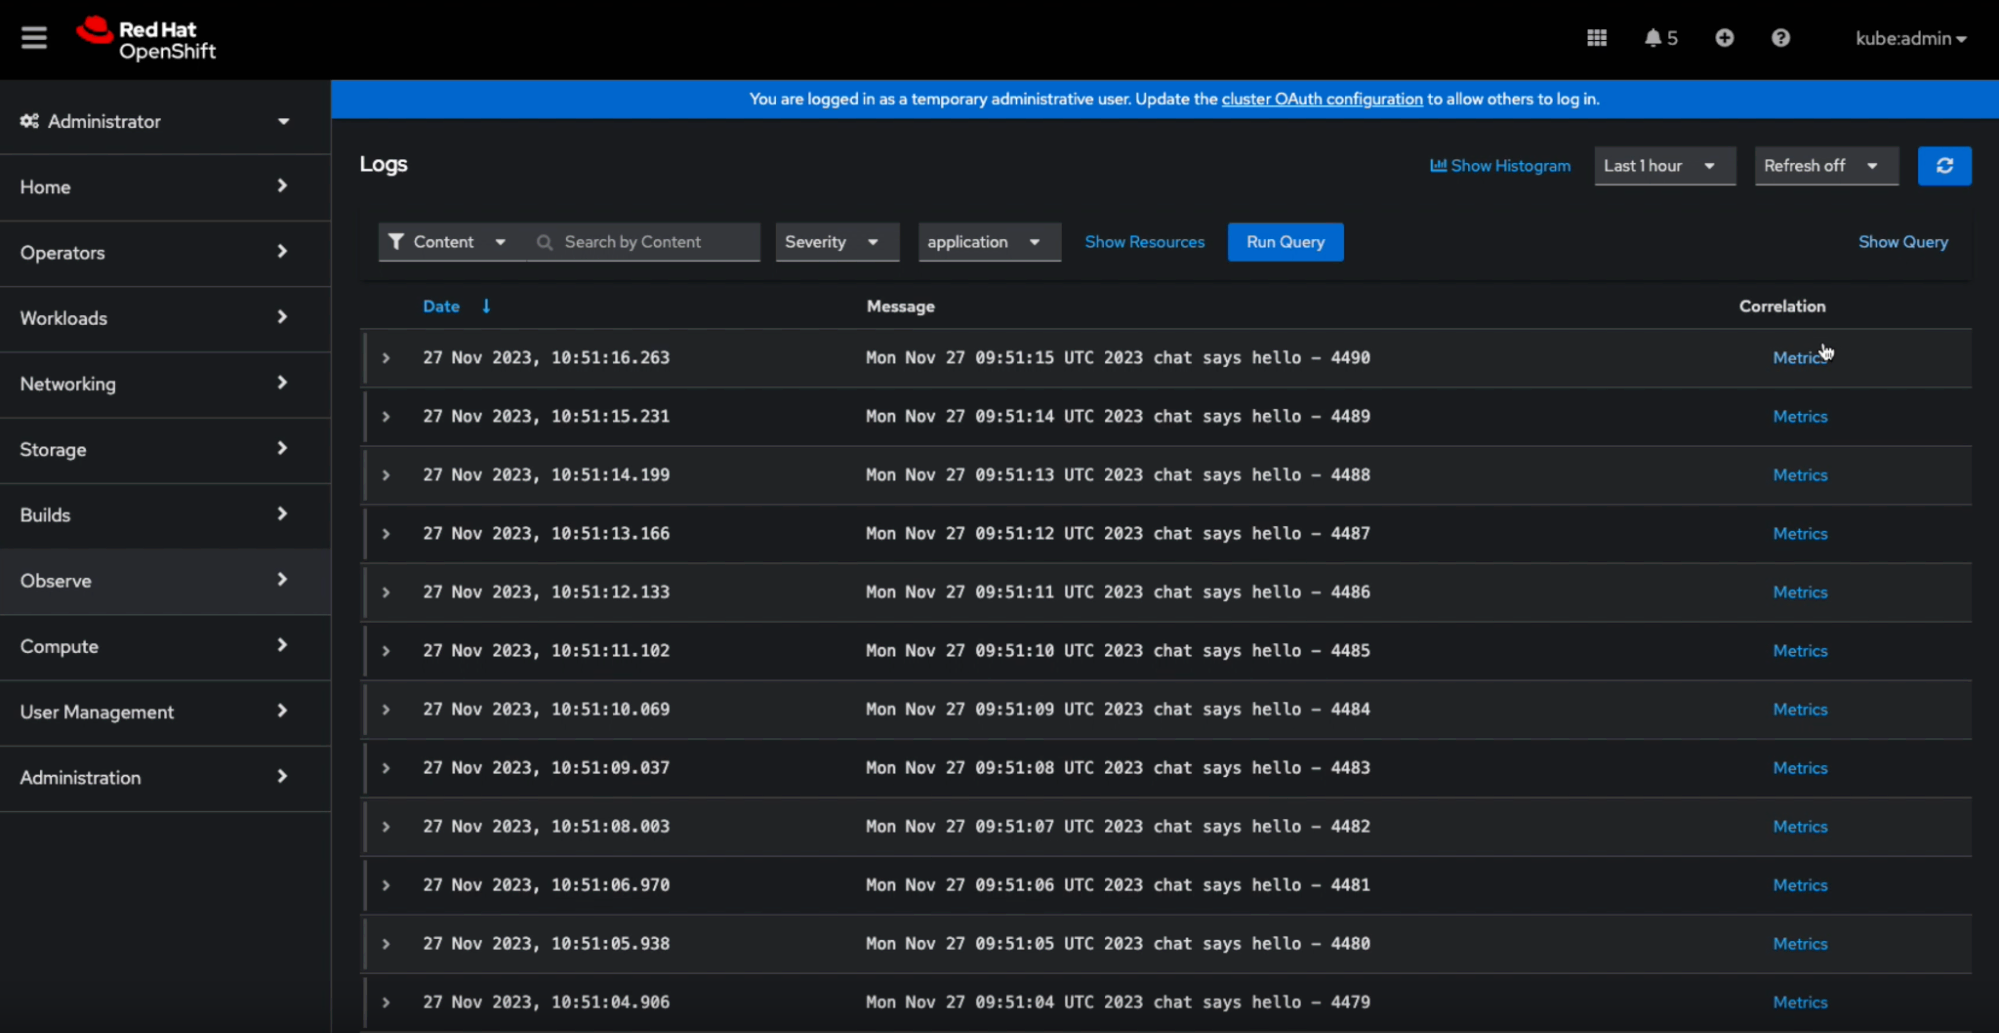
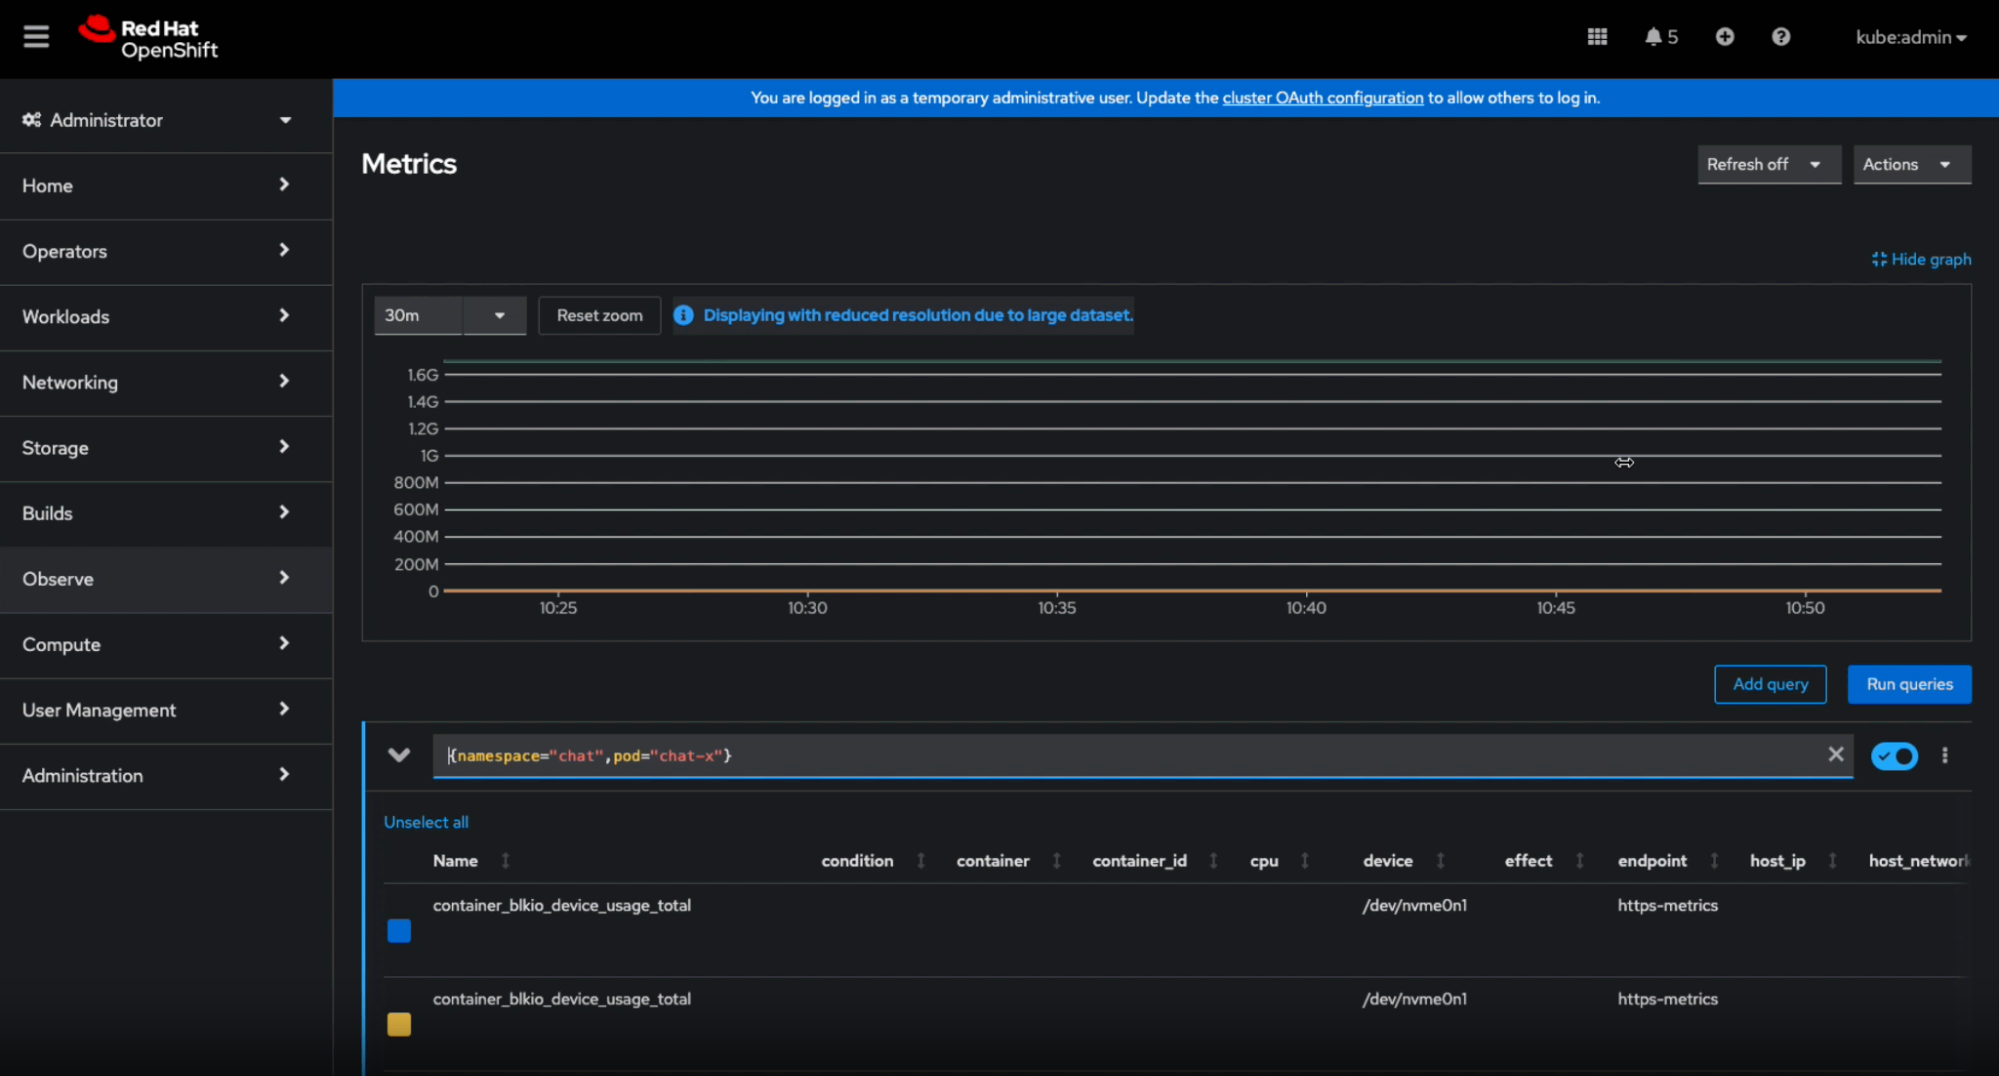
When you click Metrics, Korrel8r will find the equivalent metric to that log and redirect you to the Observe > Metrics UI, as shown in the screenshot below.
Look at the relevant documentation to learn more about it.
Deploying Korrel8r on an OpenShift cluster
You can install Korrel8r on an OpenShift cluster by using the Operator provided in the GitHub repository. Installing Korrel8r on an OpenShift cluster enables you to use the web console to view Korrel8r data.
Prerequisites
- You have administrator permissions on an OpenShift cluster, version 4.12 or newer.
- You have installed the Red Hat OpenShift Logging Operator provided by Red Hat.
- You have installed the Loki Operator provided by Red Hat and created a LokiStack custom resource (CR).
- You have created a ClusterLogging CR that configures LokiStack as the log store.
See this documentation for a complete description of the procedure.
What's next?
We are just beginning our observability signal correlation journey in OpenShift. The next steps include expanding the supported signals in Korrel8r—including Tempo—and providing OpenShift web console users with an improved user navigation experience by incorporating a debugging side-panel and a topology graph. Stay tuned for more! We look forward to receiving your feedback.
Sobre os autores

Vanessa is a Senior Product Manager in the Observability group at Red Hat, focusing on both OpenShift Analytics and Observability UI. She is particularly interested in turning observability signals into answers. She loves to combine her passions: data and languages.

Background in distributed systems and messaging middleware, nowadays focused on observability in the cloud.
Navegue por canal

Automação
Últimas novidades em automação de TI para empresas de tecnologia, equipes e ambientes

Inteligência artificial
Descubra as atualizações nas plataformas que proporcionam aos clientes executar suas cargas de trabalho de IA em qualquer ambiente

Nuvem híbrida aberta
Veja como construímos um futuro mais flexível com a nuvem híbrida

Segurança
Veja as últimas novidades sobre como reduzimos riscos em ambientes e tecnologias

Edge computing
Saiba quais são as atualizações nas plataformas que simplificam as operações na borda

Infraestrutura
Saiba o que há de mais recente na plataforma Linux empresarial líder mundial

Aplicações
Conheça nossas soluções desenvolvidas para ajudar você a superar os desafios mais complexos de aplicações

Programas originais
Veja as histórias divertidas de criadores e líderes em tecnologia empresarial
Produtos
- Red Hat Enterprise Linux
- Red Hat OpenShift
- Red Hat Ansible Automation Platform
- Red Hat Cloud Services
- Veja todos os produtos
Ferramentas
- Treinamento e certificação
- Minha conta
- Suporte ao cliente
- Recursos para desenvolvedores
- Encontre um parceiro
- Red Hat Ecosystem Catalog
- Calculadora de valor Red Hat
- Documentação
Experimente, compre, venda
Comunicação
- Contate o setor de vendas
- Fale com o Atendimento ao Cliente
- Contate o setor de treinamento
- Redes sociais
Sobre a Red Hat
A Red Hat é a líder mundial em soluções empresariais open source como Linux, nuvem, containers e Kubernetes. Fornecemos soluções robustas que facilitam o trabalho em diversas plataformas e ambientes, do datacenter principal até a borda da rede.
Selecione um idioma
Red Hat legal and privacy links
- Sobre a Red Hat
- Oportunidades de emprego
- Eventos
- Escritórios
- Fale com a Red Hat
- Blog da Red Hat
- Diversidade, equidade e inclusão
- Cool Stuff Store
- Red Hat Summit