
Introduction
In Red Hat OpenShift 4.16, we've enhanced observability to make your job easier. This article guides you through the latest features and integrations that help you monitor, troubleshoot, and optimize your OpenShift clusters more effectively than ever before.
Improved cluster monitoring
We've upgraded key components of the in-cluster monitoring stack, including Prometheus, Thanos, and kube-state-metrics.
New alerting rules help you identify deprecated fields in your Cluster Monitoring Operator, and monitor for errors when the Prometheus Operator fails to update object status.
The new metrics server automates installation, eliminates manual setup, reduces the load on your core Prometheus stack for improved overall performance, and provides direct access to the metrics.k8s.io API.
Logging 6.0: New features and important changes
Enhanced Log Forwarding with OpenTelemetry Protocol (OTLP)
We’ve enabled a new OLTP forwarder to increase your options for where you store logs. Many log stores have implemented OTLP receivers allowing them to receive logs over HTTP. Additionally, logs can be sent to a variety of analytics services for comprehensive data analysis.
These two enhancements give you control over how you work with your logs, allowing for custom and efficient log management solutions.
Increased cluster logging API functionality
We've also introduced a new and refined API in Cluster Logging Operator. The new API gives you a wide range of functionality, allowing for greater flexibility in how you work with logs (for example, you can use templating in log output).
Discontinuing Elastic, Fluentd, and Kibana support
As announced in the release of Logging 5.8, we're discontinuing support for Elastic, Fluentd, and Kibana. For users still relying on these components, here are the important dates to note:
- Logging 5.8 (EUS release): Support for Elastic, Fluentd, and Kibana until November 2025
- Logging 5.9 (non-EUS release): Support until October 2025
By focusing on modern protocols like OTLP and enhancing our APIs, we're committed to providing users with a more flexible, powerful, and future-proof logging solution in OpenShift.
Observability troubleshooting journey
Korrel8r and Observability UI plugins
With the release of Cluster Observability Operator 0.3.0, you can now deploy an enhanced developer preview of Korrel8r, a powerful tool for correlating observability signals across different data sources. The new troubleshooting panel in the OpenShift web console allows for interactive navigation of these correlated signals, helping you identify and resolve issues faster.
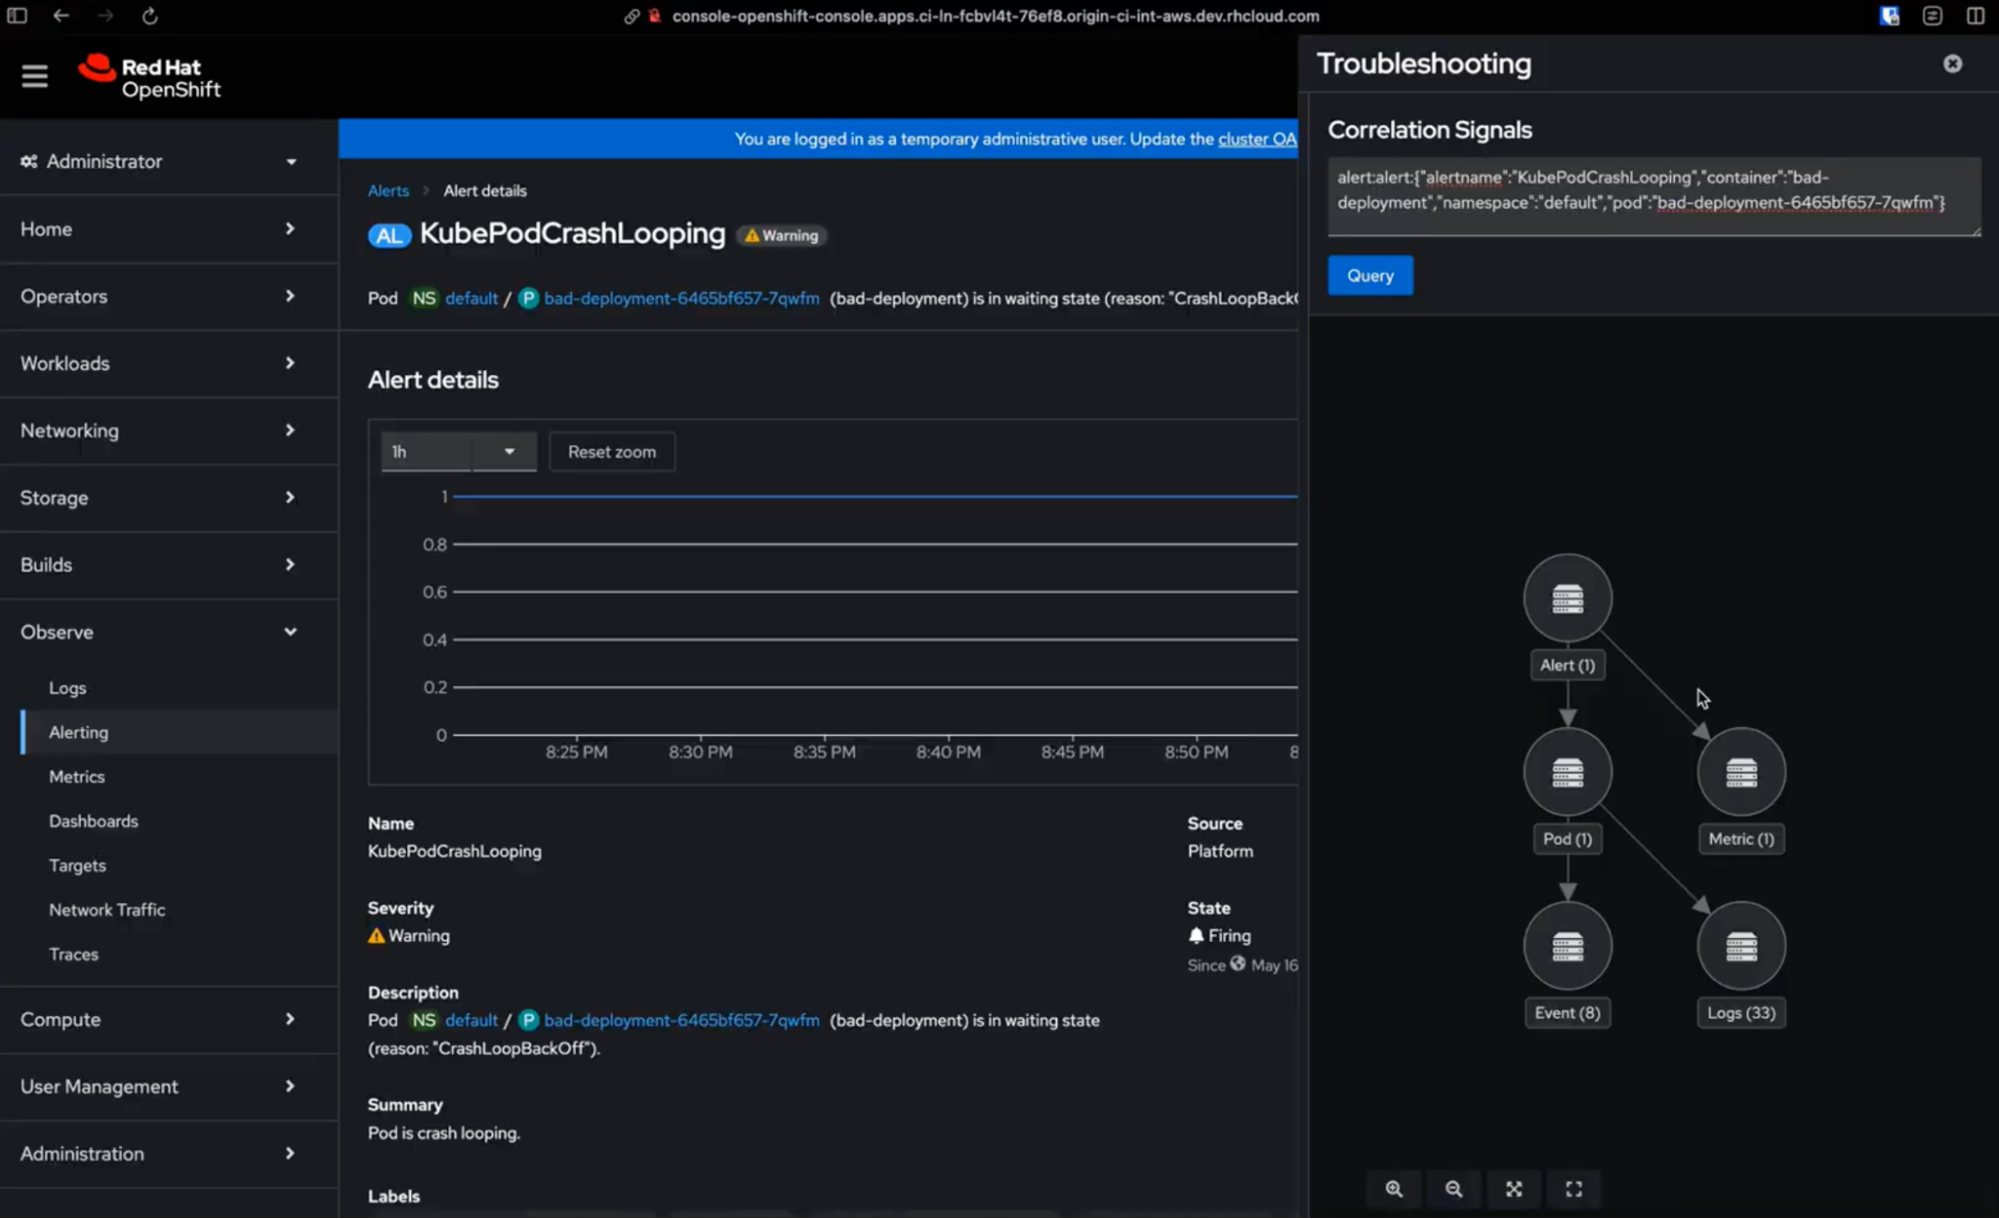
We're also introducing incident detection, a new feature that helps you prioritize critical alerts by grouping them by time and component. This tool groups related alerts that occur around the same time into incidents, reducing the noise from multiple individual alerts. By consolidating alerts into fewer, more meaningful incidents, it helps administrators focus on root causes more efficiently, potentially decreasing both Mean Time to Detection (MTTD) and Mean Time to Resolution (MTTR) for cluster issues.
Red Hat build of OpenTelemetry for seamless data collection
We recently announced the release of the Red Hat build of OpenTelemetry 3.2. Its content comes directly from the huge interest and adoption of OpenTelemetry in the whole ecosystem, but especially in OpenShift. That's why we are very happy to help our users to avoid vendor lock-in and focus on what really matters: observing their precious code and platform. To enable that, this release comes with many components available in technology preview that, step by step, are closing the loop of modern observability.
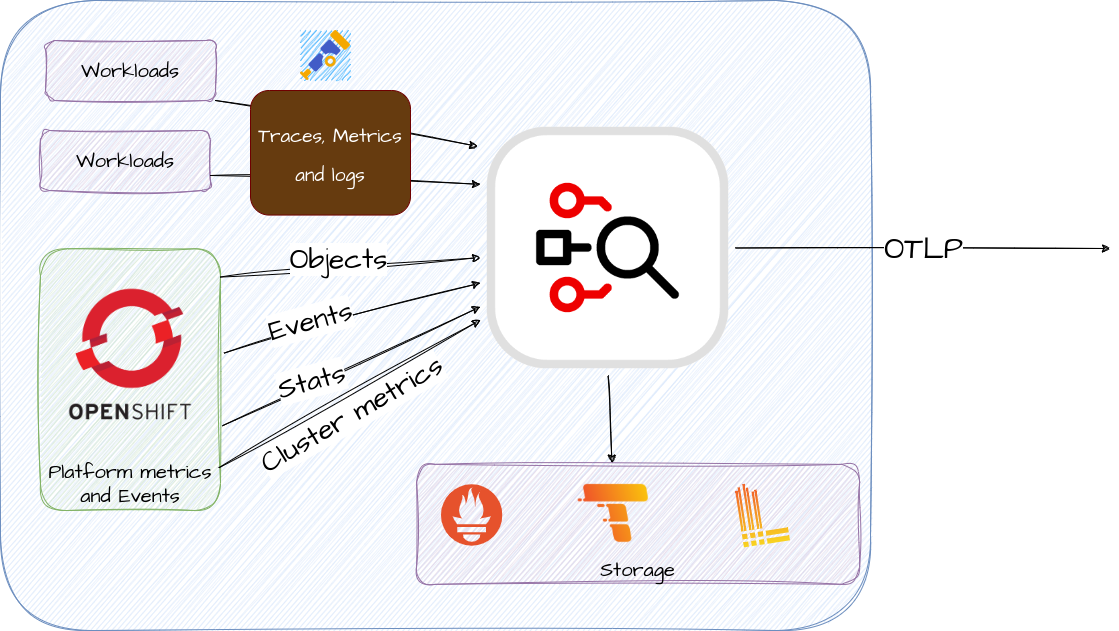
With this release, users can now start experimenting with relevant data coming from the OpenShift APIs through the Kubernetes cluster, events, objects and stats receivers and transform them to useful metrics and logs that can become very relevant while troubleshooting complex issues. Drop by our official docs to know more!
Some examples of these co-creation exercises are already being shared showcasing how we expanded our OpenShift platform with OpenTelemetry capabilities to facilitate users achieving their observability goals. It's wild how, instead of just saying "we can't do this'' or "we don't support that", great individuals push the boundaries by thinking out of the box, with OpenTelemetry. See OpenShift Commons Denver: How IndiGo Airlines elevated IT and business analytics with a data mesh or OpenShift Commons KubeCon EU 2024 - ABB case study: Converging OT and IT at the edge to learn more about these fascinating success stories.
Last but not least, if you are curious on how the OpenTelemetry protocol can be used on OpenShift to ingest in-cluster data (workloads instrumented with OpenTelemetry) and how telemetry data can be exported from OpenShift via OTLP, you can read Red Hat OpenShift as OpenTelemetry (OTLP) native platform, or watch OpenShift Commons: OpenTelemetry and distributed tracing.
Distributed tracing with the Tempo Operator
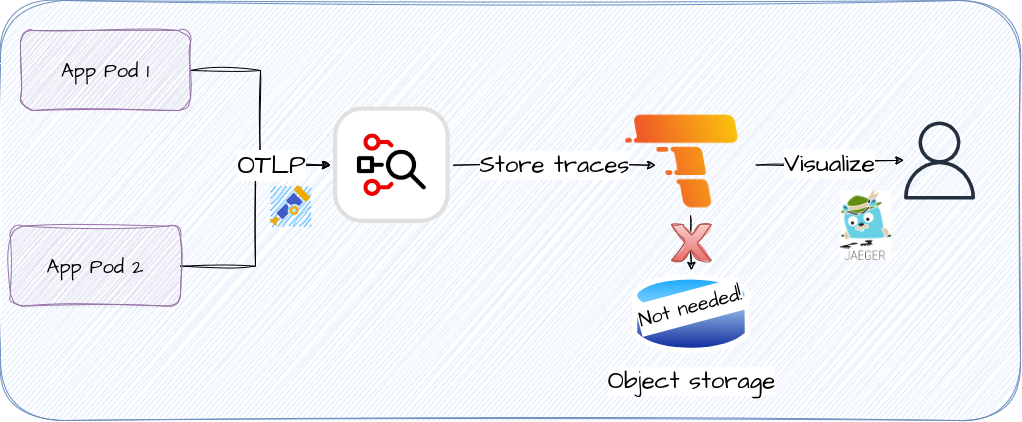
We acknowledge the fact that the path to modern observability is not always easy. Managing storage has many nuances that can easily put the hype to sleep. Especially when adopting new technologies such as distributed tracing, where in some cases users just need fast activation for hot debugging sessions. Observing spans in demos and while developing may also be very useful. In these scenarios, installing a separate object store to the backend may result in the greatest user experience. That’s why, in the Red Hat OpenShift distributed tracing platform 3.2, based on the Tempo operator, we are enabling the technology preview of the Tempo Monolithic mode via the operator. Experienced distributed tracing users may find that it is able to provide a similar experience to the Jaeger all-in-one deployment. Stay tuned because we'll deep dive into this in another article soon.
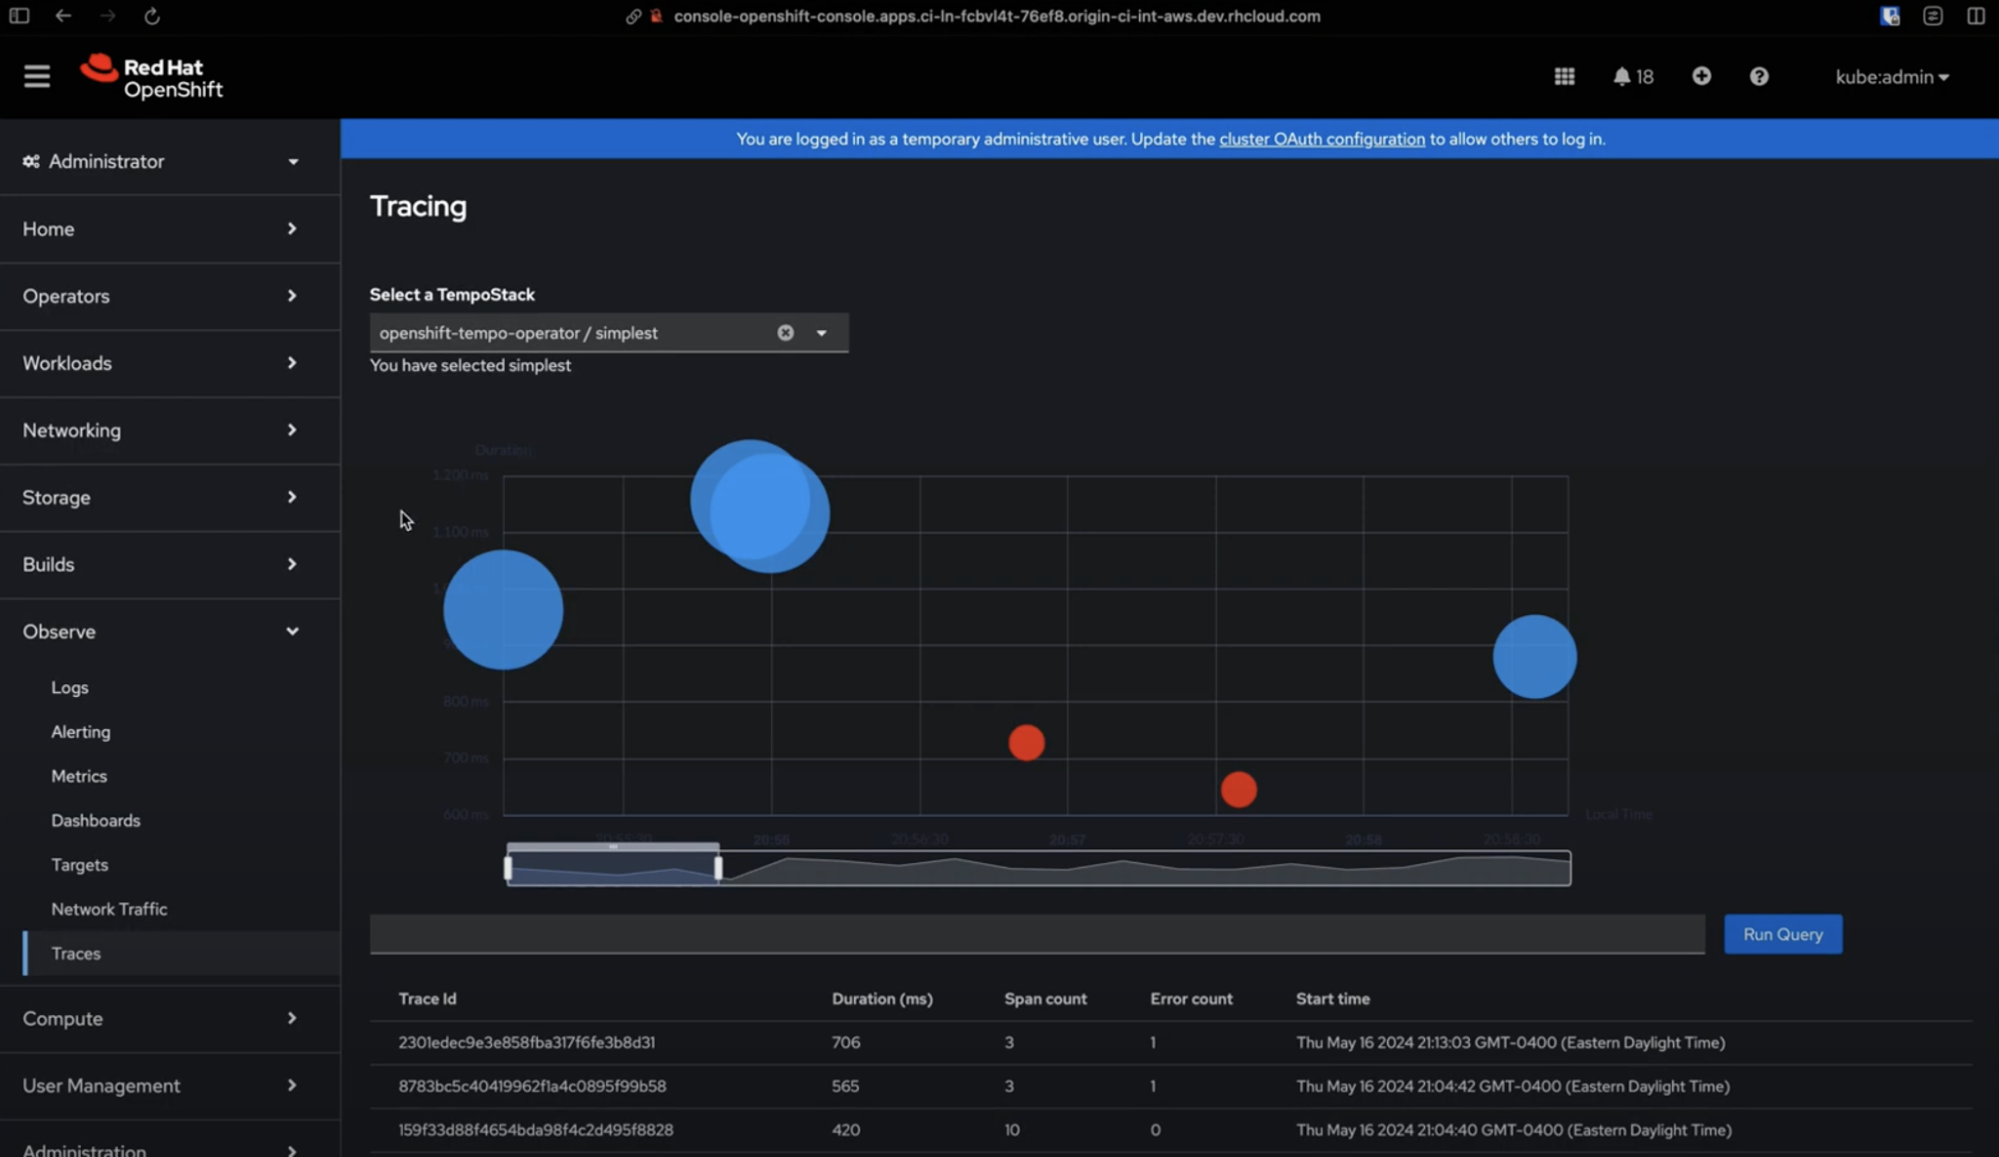
A new addition to the OpenShift tracing family is the Traces UI, now available to OpenShift customers as part of the latest Cluster Observability Operator 0.3.0 release. By accessing the OpenShift web console, you will be able to explore spans via the relevant Scatter Plot and table just below it. This is a developer preview feature, and we are looking forward to receiving feedback from our customers. To enhance the exploration experience, a Gantt Chart will be added as part of the technology preview release - planned for later this year. Both the Jaeger UI deployed by the Tempo operator and the Traces UI plugin in the OpenShift console will coexist while we work towards reaching feature parity.
Disclaimer: In the current Traces UI developer preview release, multi-tenancy is not yet supported. This means that in the current setup, there is no getaway when multi-tenancy is not enabled. Users can access the new Traces UI, but it will be open without any authentication.
Power monitoring 0.2 - updated technology preview
The new release of Power Monitoring (available as a technology preview) includes an updated version of the Kepler upstream project (0.7.10), power monitoring operator and enhanced UI integration within the OpenShift web console. For improved data accuracy on bare metal OpenShift installations, you can now enable the Redfish API integration in Kepler. Kepler will use Redfish to get the power consumed by nodes. The updated operator allows you to install the Power Monitoring Operator in the namespace of your choice and with this update, you also get a new power monitoring overview dashboard in the developer view of the OpenShift console.
Even though power monitoring is still in technology preview, it’s an active upstream project that gets a lot of attention from upstream communities and our customers. Our customer Ortec Finance presented at Red Hat OpenShift Commons on how to reduce your carbon footprint with dynamic workload shifting through time and space on Red Hat OpenShift. The company decided to use Red Hat Power monitoring to measure the power impact of changes they introduced to their workloads and to continuously monitor the impact of such changes.
What’s next for Red Hat OpenShift Observability?
While we love all these features delivered as part of our Observability platform, we are already pushing forward to add new functionality to further help our users From providing sizing tips and estimates in Tempo, to a new Gantt Chart in the latest tracing UI console, mixed with FIPs compliance, security hardening and certificate rotation for the distributed tracing platform. In the area of OpenTelemetry, we are adding new features in the collector such as AMQP/RabbitMQ receiver and exporter, or multi-container auto instrumentation in the Instrumentation CR. That’s not all, in our effort to provide a truly open observability platform for the cloud, edge and multi-cluster environments, we are working with the community to support OTLP internally in Tempo and enabling OTLP ingestion natively for Loki.
Conclusion
The enhancements in Red Hat OpenShift 4.16 represent a significant step forward in our observability capabilities. By integrating advanced troubleshooting tools, expanding our OpenTelemetry support, and improving our distributed tracing and power monitoring features, we're empowering users to maintain and optimize their OpenShift environments more effectively.
Key Takeaways
• New troubleshooting tools for faster issue resolution
• Expanded OpenTelemetry support for comprehensive data collection
• Enhanced distributed tracing capabilities
• Improved power monitoring for better resource management
Ready to explore these new features? Visit the documentation page to learn more and get started with the latest observability tools in OpenShift 4.16.
Red Hat’s Developers Observability page contains information to help you learn about and implement observability capabilities.
We value your feedback! Share your thoughts and suggestions using the Red Hat OpenShift feedback form.
关于作者

Jamie Parker is a Product Manager at Red Hat who specializes in Observability, particularly in the Logging and OpenStack areas. At Red Hat, Jamie works with organizations and customers to learn about their needs within the ever changing Observability landscape, and based on their feedback, helps to guide upcoming products within the Red Hat Observability Platform. Jamie enjoys sharing lessons learned to the community by frequently speaking at meetups and conferences, and by blogging.

Vanessa is a Senior Product Manager in the Observability group at Red Hat, focusing on both OpenShift Analytics and Observability UI. She is particularly interested in turning observability signals into answers. She loves to combine her passions: data and languages.

Jose is a Senior Product Manager at Red Hat OpenShift, with a focus on Observability and Sustainability. His work is deeply related to manage the OpenTelemetry, distributed tracing and power monitoring products in Red Hat OpenShift.
His expertise has been built from previous gigs as a Software Architect, Tech Lead and Product Owner in the telecommunications industry, all the way from the software programming trenches where agile ways of working, a sound CI platform, best testing practices with observability at the center have presented themselves as the main principles that drive every modern successful project.
With a heavy scientific background on physics and a PhD in Computational Materials Engineering, curiousity, openness and a pragmatic view are always expected. Beyond the boardroom, he is a C++ enthusiast and a creative force, contributing symphonic and electronic touches as a keyboardist in metal bands, when he is not playing videogames or lowering lap times at his simracing cockpit.

Roger Florén, a dynamic and forward-thinking leader, currently serves as the Principal Product Manager at Red Hat, specializing in Observability. His journey in the tech industry is marked by high performance and ambition, transitioning from a senior developer role to a principal product manager. With a strong foundation in technical skills, Roger is constantly driven by curiosity and innovation. At Red Hat, Roger leads the Observability platform team, working closely with in-cluster monitoring teams and contributing to the development of products like Prometheus, AlertManager, Thanos and Observatorium. His expertise extends to coaching, product strategy, interpersonal skills, technical design, IT strategy and agile project management.
更多此类内容


产品
工具
试用购买与出售
沟通
关于红帽
我们是世界领先的企业开源解决方案供应商,提供包括 Linux、云、容器和 Kubernetes。我们致力于提供经过安全强化的解决方案,从核心数据中心到网络边缘,让企业能够更轻松地跨平台和环境运营。