
It’s been a few weeks since the release of the first tech preview of Istio on OpenShift. Since then a lot has happened, and we are happy to announce the availability of our second tech preview release.
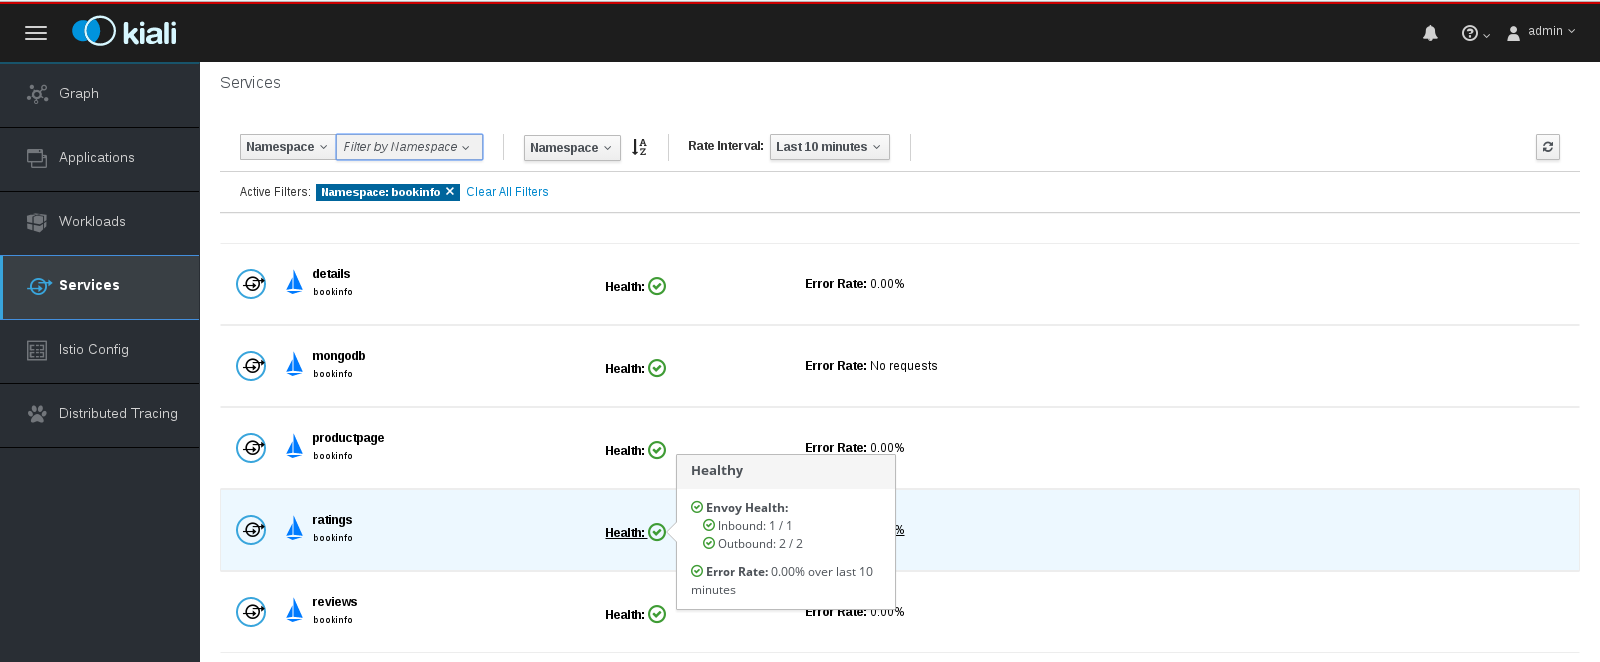
In this release we are adding a whole new user interface from the upstream Kiali project. The Kiali user interface can help Istio users understand what’s happening in their service mesh, canl show how the various components are connected, and can help to detect issues (HTTP 500, pod not started, misconfigurations) to better fix those.
Here are some of the core features of Kiali:
- Collect health information: Kiali will display the health of services and inter-service requests. For example, Kiali will aggregate health data from Kubernetes (Pod health) as well as from Istio Mixer (error rates below a threshold).
- Service mesh visualization: A graph displays how the various components of the mesh are related/connected. The service mesh graph offers many configuration options to customize the data displayed. One can choose how service versions are displayed, choose to display the number of requests over time, or the request’s time (how long the request took by average or percentiles) between two components.
An animated graph helps provide a more natural way to visualize both the inter-component request latency (speed of the dots) and the amount of traffic between two components (number of dots). An example service graph is shown below.
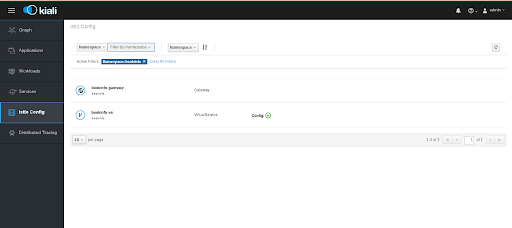
- Configuration validation (Configuration editing is planned for a future release): It can be error prone to write Istio configuration, Kiali can help finding out some common errors, in future releases, Kiali plans to complement Istio Galley.
A Kiali tutorial is available in the OpenShift Service Mesh installation guide. The guide will not only provide you with information on Kiali, but will also help you to install the whole Service Mesh suite, including Jaeger for distributed tracing and Grafana (for deeper metrics analysis), on an existing OpenShift 3.10 (or later) cluster.
Kiali is a project originally started by Red Hat engineers who are also contributing to Istio. Starting from the 1.1 release of Istio, Kiali is expected to become the default visualization console. Kiali is in a very active/rapid state of development, and the upstream community will be happy to get feedback and contributions.
Red Hat’s aim is to regularly release Tech Preview drops over the coming months. Stay tuned, and be sure to provide us with your feedback on OpenShift Service Mesh - we want to take your comments into account!
关于作者


产品
工具
试用购买与出售
沟通
关于红帽
我们是世界领先的企业开源解决方案供应商,提供包括 Linux、云、容器和 Kubernetes。我们致力于提供经过安全强化的解决方案,从核心数据中心到网络边缘,让企业能够更轻松地跨平台和环境运营。