The number of available container runtimes has grown since the release of the Open Container Initiative and runtime-spec (runc). This growth is due to Kubernetes introducing the Container Runtime Interface (CRI) that provides a common interface for interactions between kubelet and the container runtime.
While the original container runtimes like Docker and RKT aimed to meet multiple use cases having complete userspace CLI tools, newer container runtimes such as CRI-O, runC, and crun are targeted at Kubernetes-only use cases and do not have CLI tooling.
One solution for this lack of a CLI is cri-tools. It provides the tool crictl, a common interface to triage issues locally on a Kubernetes node regardless of the container runtime leveraged by Kubelet. The Kubernetes sig-node group released these tools.
This article will highlight useful commands that assist a systems administrator in understanding the state of containers running on a specific node in a Kubernetes cluster. This is helpful with container workload issues on a particular cluster node, especially when they impact the node's ability to communicate in the cluster.
Investigate images
Kubernetes caches container images locally in the runtime's image store. Issues can occur where images differ between nodes, leading to inconsistent deployment behavior. You can identify these differences using the commands covered below.
The command crictl images lists the container images cached locally on the node. This command also shows system images that make up components of the cluster, including the images of cluster-level components.
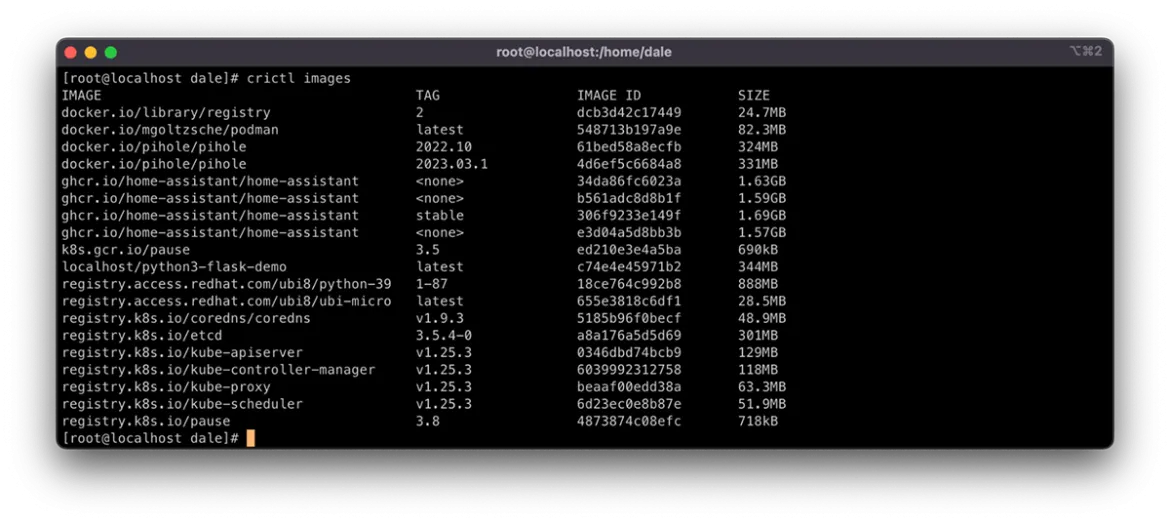
You can list images by using kubectl get pods, but this does not show system containers and requires using template filtering of the output to get a clear list. The Kubernetes documentation has a comprehensive how-to here.
Once you list the images, you can gather further information. It is useful to compare image information to understand where deviation occurs. Do this by using crictl inspect <image id>. The <image id> can be found using crictl images as described above.
As you can see in the screenshot below, the output provides metadata, such as repository checksums, container size, and image layer IDs. All of these can be indicators that the image differs in some way.
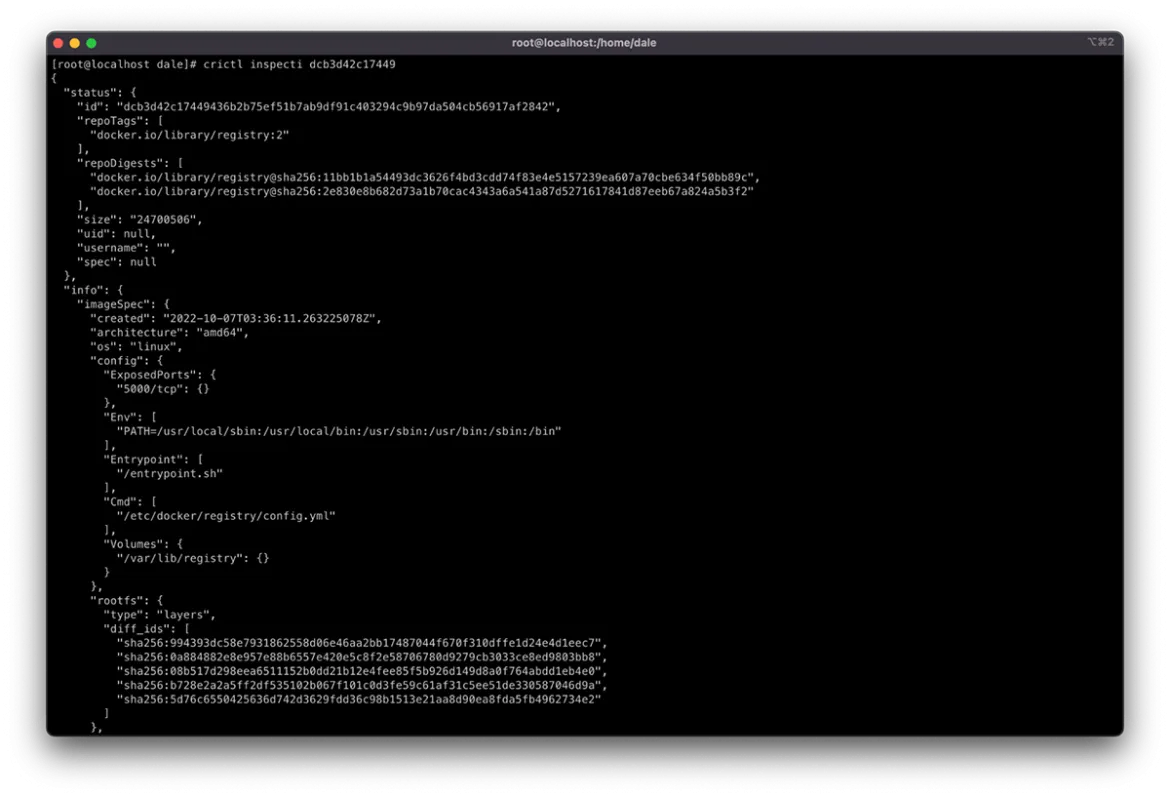
The output also provides a history of the layers that have been added to the container's copy-on-write filesystem. The number of entries in the history that do not contain "empty_layer": true should match the number of layer IDs in the diff_ids.
One solution to image problems is removing instances of the cached image from the impacted nodes. Doing this forces the node to redownload the image from the defined registry in the Pod spec the next time the container is scheduled to the node. Remove these images using the command crictl rmi <image id>.
Manipulating pods and containers on the node
Pods and the containers running in them can directly impact a node's state in a Kubernetes cluster, whether it is resource consumption or node service management, like networking.
The crictl command manipulates pods and containers similar to Docker and Podman. You can do this using the subcommands start, stop, run, and rm. They provide the ability to manage the container lifecycle in an isolated sandbox.
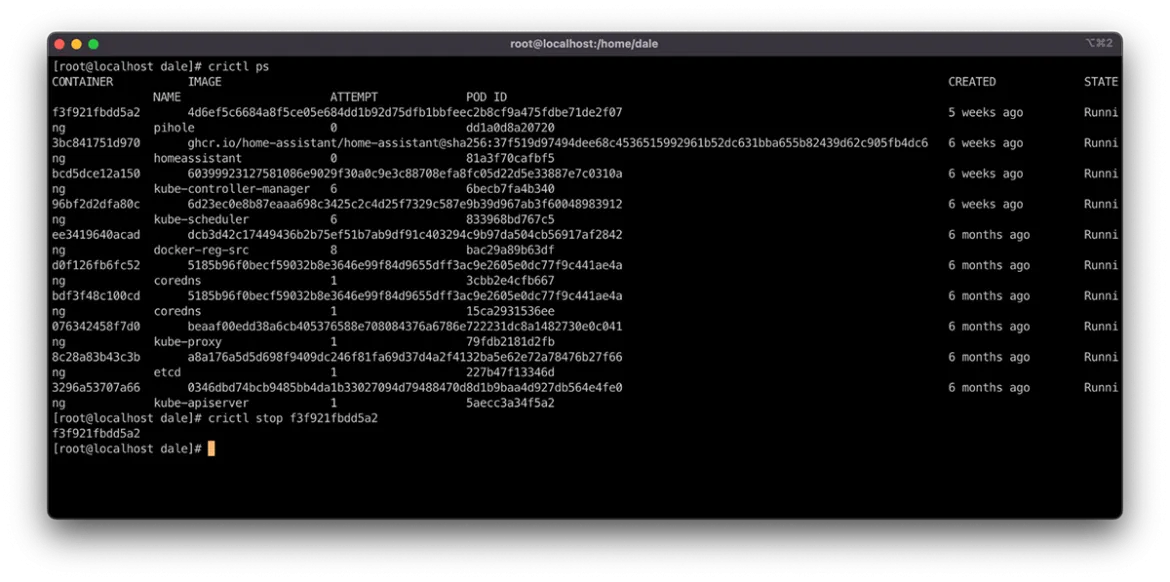
You can manage Pods in the same way using the same subcommand pattern as above. However, these subcommands have a suffix of p, making them runp, stopp, and rmp.
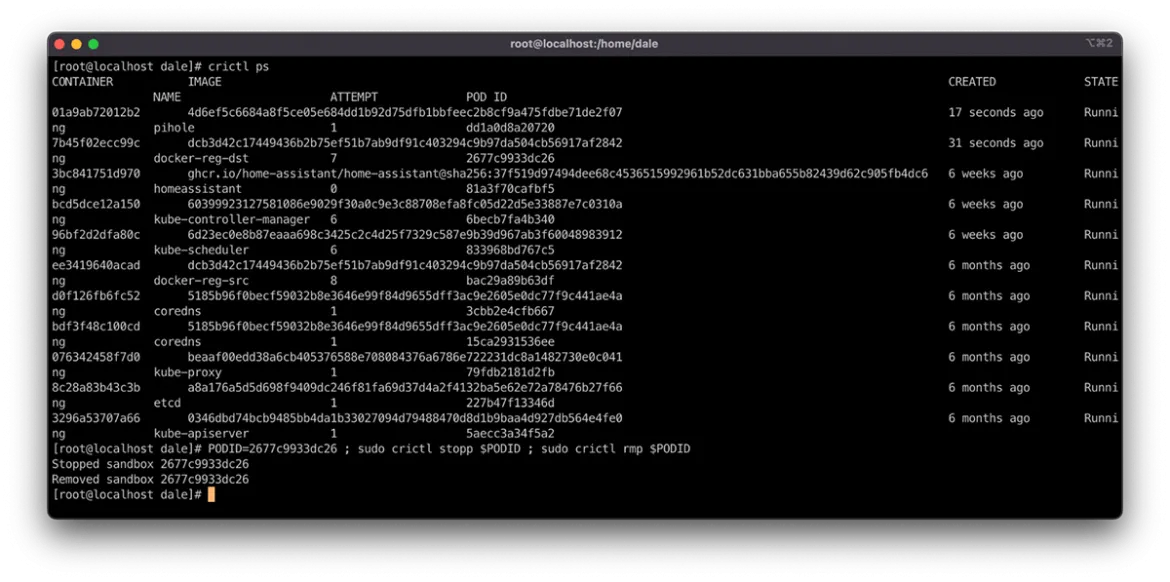
These are handy commands for resolving container node issues. Stopping a container within a Pod using the command crictl stop <container id> causes it to deploy a new container instance. You can force a Pod through the rescheduling cycle by stopping and then removing it via the PODID. This uses the stopp and rmp subcommands, as seen in the following example:
PODID=<PODID> ; sudo crictl stopp $PODID ; sudo crictl rmp $PODID
Rescheduling a Pod from the node can relieve resource pressure through scheduling evaluation or causing the workload to do any startup activities that could reinitialize connectivity or service for the node.
Connect and execute commands
You often need to dig deeper into the container's state and configuration to understand the root cause of issues impacting the platform.
Do this using commands similar to single-host containerization solutions like docker and podman. The command crictl exec -it <CONTAINER ID> /bin/bash creates an interactive session in a pseudo TTY where the command /bin/bash is executed, creating a terminal session to interact with.
Some minimalist containers may be configured without a shell. In this case, you can leverage the same crictl exec command to execute any binary in the container image. Do this using the following format:
crictl exec <CONTAINER ID> <command>
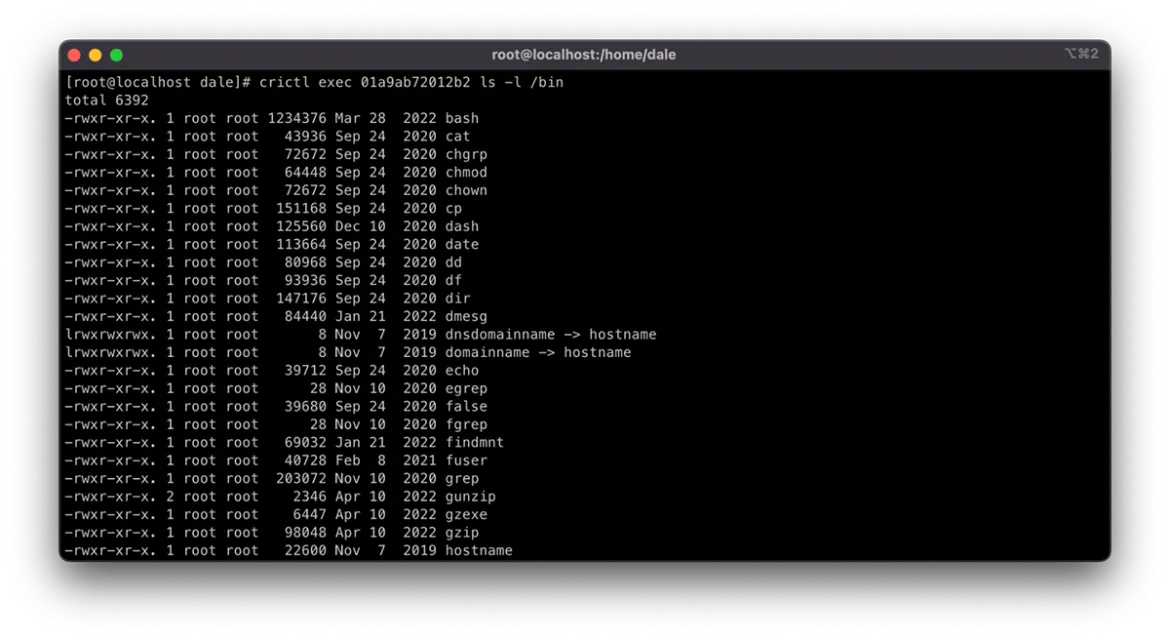
The example below shows the above pattern being used to list the contents of the /bin directory in the container. It displays all of the available commands that exist in the container.
Understanding where resources are being used
One of the biggest impacts on Kubernetes nodes is the load generated by workloads on densely packed clusters. There are many options for defining and managing resource consumption in Kubernetes. For example, LimitRange resources manage resource limits at the Pod level and ResourceQuota resources manage resources at the Namespace level.
However, the Kubernetes scheduler will schedule Pods onto nodes only taking into account the availability of resources requested in the Requests, but not the peak load usage defined in the Limits. These are optional, and if no Requests are defined, they are counted as 0, meaning the scheduler will not consider resource requirements when allocating the Pod to a node. Nodes may then contend for resources, which is great for workload density. However, without proper management, it can cause the node to become CPU or memory-bound, impacting its ability to serve requests.
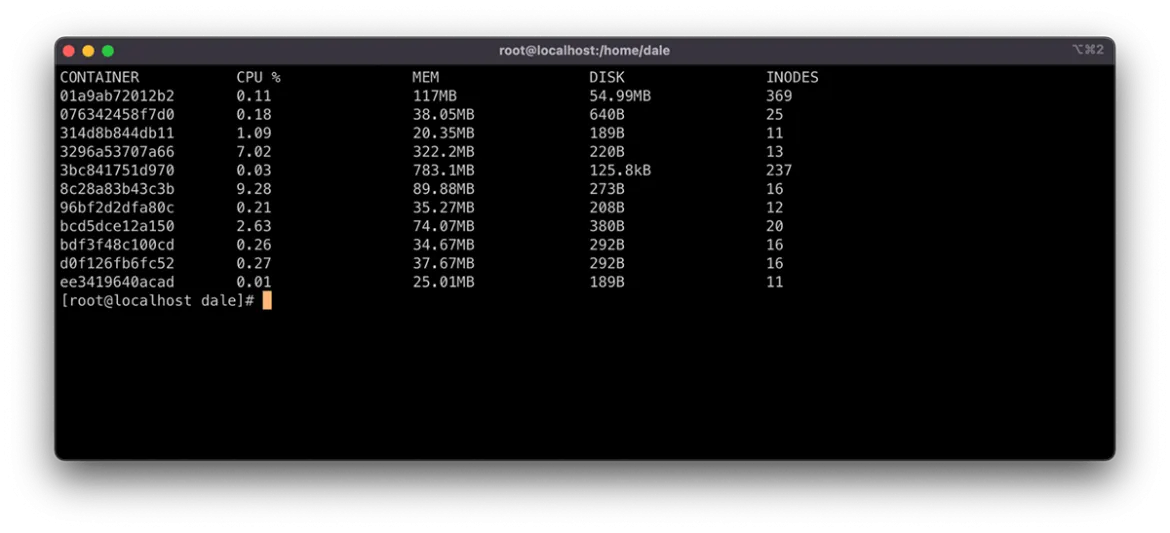
You can view resource usage using the command crictl stats. This command displays the resource consumption for each container running on the node, allowing an administrator to take action to restore service using the methods described above.
In addition to manually intervening in managing node resources, you can leverage Admission Controllers and Eviction Policies to automate resource preservation. This approach does require additional resource configuration and tuning to run effectively in the cluster and this article will not address it.
Sometimes it makes sense to pat the cattle a bit
Being able to dispose of impacted cluster nodes and quickly recreate them is a great feature to have on your Kubernetes cluster. It assists support engineers with service restoration and meeting RTO and RPO objectives.
Resolution sometimes means treating these disposable hosts as pets and working through recurrent issues. The addition of a NodeSelector or taint/toleration can often resolve various problems in a Kubernetes ecosystem and crictl is a great option to dig in and understand the state of an impacted node in detail to plan these updates.
À propos de l'auteur
Dale has been part of Consulting at Deloitte since 2015. With over two decades of experience, Dale specializes in crafting secure and nationally significant cloud platforms. Leveraging expertise that pans architecture, design and delivery, with a focus on containerization, automation and DevOps.
Between deployments you'll find Dale knee-deep in the soil, dabbling in agriculture on the farm, or in the workshop, cooking up all kinds of cool stuff with 3D printing, wood and metal.
Contenu similaire
Parcourir par canal
Automatisation
Les dernières nouveautés en matière d'automatisation informatique pour les technologies, les équipes et les environnements
Intelligence artificielle
Actualité sur les plateformes qui permettent aux clients d'exécuter des charges de travail d'IA sur tout type d'environnement
Cloud hybride ouvert
Découvrez comment créer un avenir flexible grâce au cloud hybride
Sécurité
Les dernières actualités sur la façon dont nous réduisons les risques dans tous les environnements et technologies
Edge computing
Actualité sur les plateformes qui simplifient les opérations en périphérie
Infrastructure
Les dernières nouveautés sur la plateforme Linux d'entreprise leader au monde
Applications
À l’intérieur de nos solutions aux défis d’application les plus difficiles
Programmes originaux
Histoires passionnantes de créateurs et de leaders de technologies d'entreprise
Produits
- Red Hat Enterprise Linux
- Red Hat OpenShift
- Red Hat Ansible Automation Platform
- Services cloud
- Voir tous les produits
Outils
- Formation et certification
- Mon compte
- Assistance client
- Ressources développeurs
- Rechercher un partenaire
- Red Hat Ecosystem Catalog
- Calculateur de valeur Red Hat
- Documentation
Essayer, acheter et vendre
Communication
- Contacter le service commercial
- Contactez notre service clientèle
- Contacter le service de formation
- Réseaux sociaux
À propos de Red Hat
Premier éditeur mondial de solutions Open Source pour les entreprises, nous fournissons des technologies Linux, cloud, de conteneurs et Kubernetes. Nous proposons des solutions stables qui aident les entreprises à jongler avec les divers environnements et plateformes, du cœur du datacenter à la périphérie du réseau.
Sélectionner une langue
Red Hat legal and privacy links
- À propos de Red Hat
- Carrières
- Événements
- Bureaux
- Contacter Red Hat
- Lire le blog Red Hat
- Diversité, équité et inclusion
- Cool Stuff Store
- Red Hat Summit

