
The number of available container runtimes has grown since the release of the Open Container Initiative and runtime-spec (runc). This growth is due to Kubernetes introducing the Container Runtime Interface (CRI) that provides a common interface for interactions between kubelet and the container runtime.
While the original container runtimes like Docker and RKT aimed to meet multiple use cases having complete userspace CLI tools, newer container runtimes such as CRI-O, runC, and crun are targeted at Kubernetes-only use cases and do not have CLI tooling.
One solution for this lack of a CLI is cri-tools. It provides the tool crictl, a common interface to triage issues locally on a Kubernetes node regardless of the container runtime leveraged by Kubelet. The Kubernetes sig-node group released these tools.
This article will highlight useful commands that assist a systems administrator in understanding the state of containers running on a specific node in a Kubernetes cluster. This is helpful with container workload issues on a particular cluster node, especially when they impact the node's ability to communicate in the cluster.
Investigate images
Kubernetes caches container images locally in the runtime's image store. Issues can occur where images differ between nodes, leading to inconsistent deployment behavior. You can identify these differences using the commands covered below.
The command crictl images lists the container images cached locally on the node. This command also shows system images that make up components of the cluster, including the images of cluster-level components.
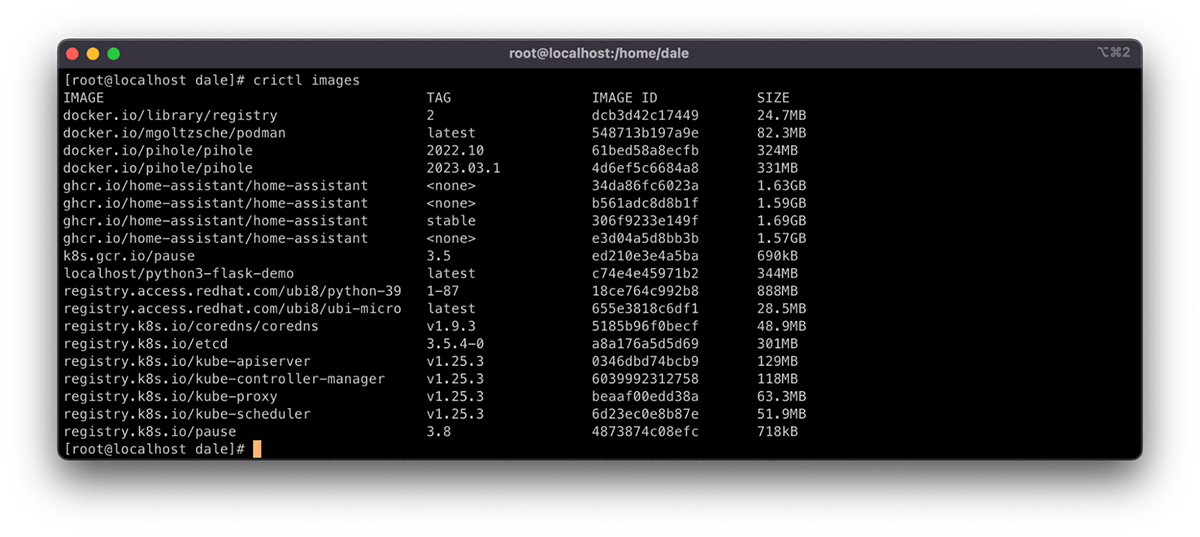
You can list images by using kubectl get pods, but this does not show system containers and requires using template filtering of the output to get a clear list. The Kubernetes documentation has a comprehensive how-to here.
Once you list the images, you can gather further information. It is useful to compare image information to understand where deviation occurs. Do this by using crictl inspect <image id>. The <image id> can be found using crictl images as described above.
As you can see in the screenshot below, the output provides metadata, such as repository checksums, container size, and image layer IDs. All of these can be indicators that the image differs in some way.
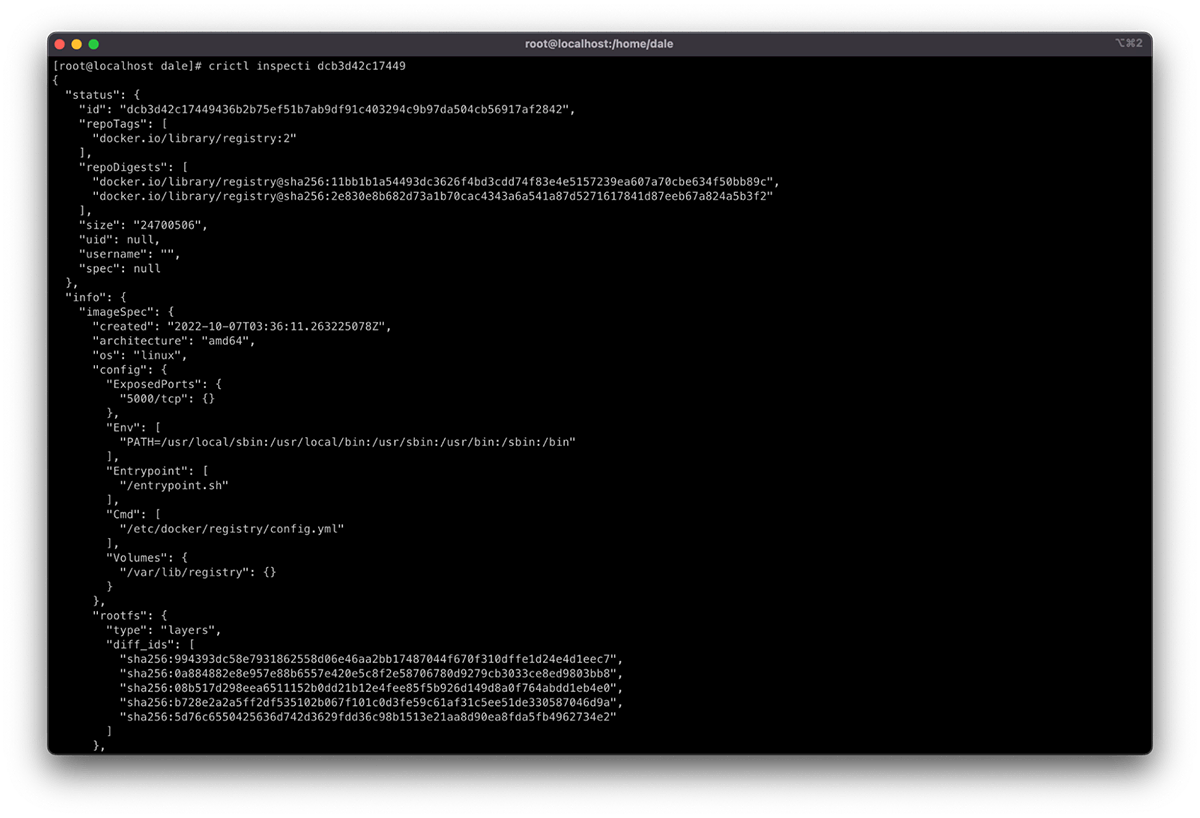
The output also provides a history of the layers that have been added to the container's copy-on-write filesystem. The number of entries in the history that do not contain "empty_layer": true should match the number of layer IDs in the diff_ids.
One solution to image problems is removing instances of the cached image from the impacted nodes. Doing this forces the node to redownload the image from the defined registry in the Pod spec the next time the container is scheduled to the node. Remove these images using the command crictl rmi <image id>.
Manipulating pods and containers on the node
Pods and the containers running in them can directly impact a node's state in a Kubernetes cluster, whether it is resource consumption or node service management, like networking.
The crictl command manipulates pods and containers similar to Docker and Podman. You can do this using the subcommands start, stop, run, and rm. They provide the ability to manage the container lifecycle in an isolated sandbox.
You can manage Pods in the same way using the same subcommand pattern as above. However, these subcommands have a suffix of p, making them runp, stopp, and rmp.

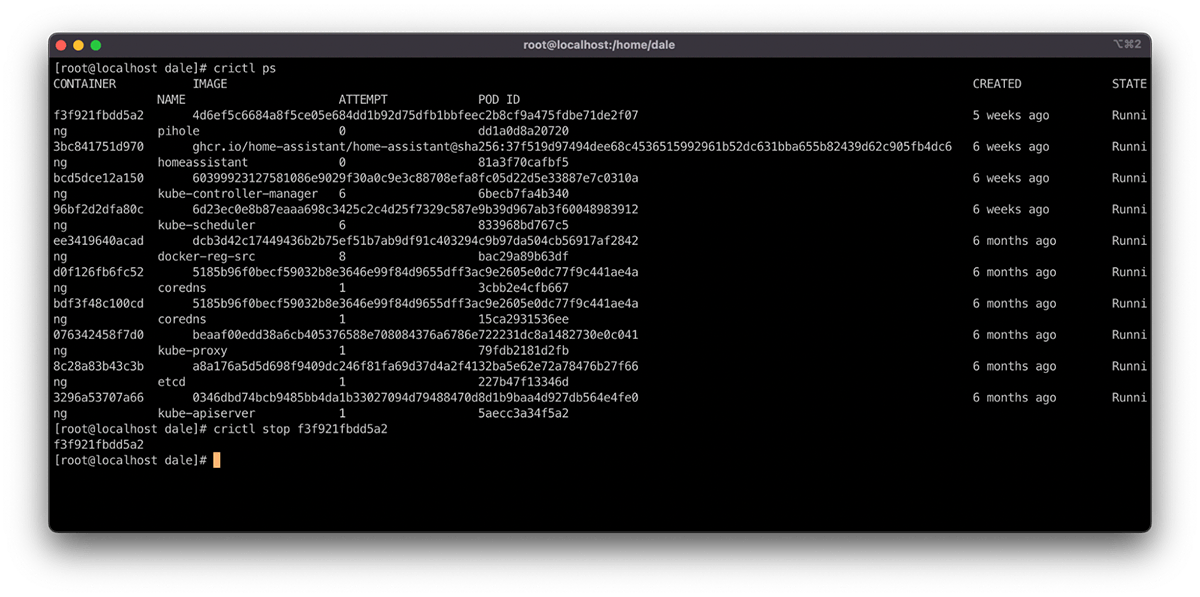
These are handy commands for resolving container node issues. Stopping a container within a Pod using the command crictl stop <container id> causes it to deploy a new container instance. You can force a Pod through the rescheduling cycle by stopping and then removing it via the PODID. This uses the stopp and rmp subcommands, as seen in the following example:
PODID=<PODID> ; sudo crictl stopp $PODID ; sudo crictl rmp $PODID
Rescheduling a Pod from the node can relieve resource pressure through scheduling evaluation or causing the workload to do any startup activities that could reinitialize connectivity or service for the node.
Connect and execute commands
You often need to dig deeper into the container's state and configuration to understand the root cause of issues impacting the platform.
Do this using commands similar to single-host containerization solutions like docker and podman. The command crictl exec -it <CONTAINER ID> /bin/bash creates an interactive session in a pseudo TTY where the command /bin/bash is executed, creating a terminal session to interact with.
Some minimalist containers may be configured without a shell. In this case, you can leverage the same crictl exec command to execute any binary in the container image. Do this using the following format:
crictl exec <CONTAINER ID> <command>
The example below shows the above pattern being used to list the contents of the /bin directory in the container. It displays all of the available commands that exist in the container.

Understanding where resources are being used
One of the biggest impacts on Kubernetes nodes is the load generated by workloads on densely packed clusters. There are many options for defining and managing resource consumption in Kubernetes. For example, LimitRange resources manage resource limits at the Pod level and ResourceQuota resources manage resources at the Namespace level.
However, the Kubernetes scheduler will schedule Pods onto nodes only taking into account the availability of resources requested in the Requests, but not the peak load usage defined in the Limits. These are optional, and if no Requests are defined, they are counted as 0, meaning the scheduler will not consider resource requirements when allocating the Pod to a node. Nodes may then contend for resources, which is great for workload density. However, without proper management, it can cause the node to become CPU or memory-bound, impacting its ability to serve requests.
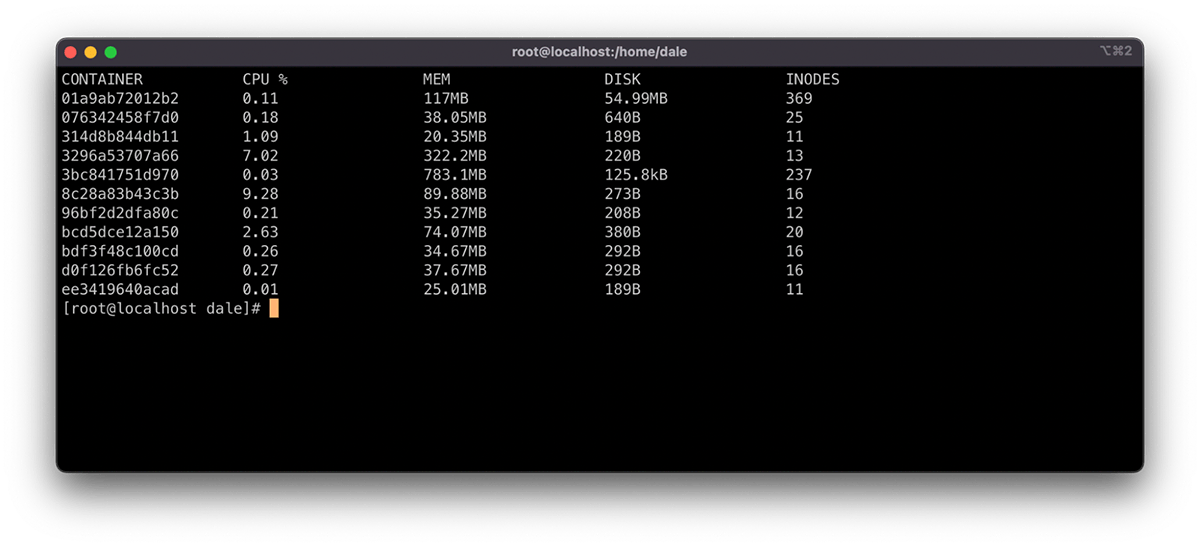
You can view resource usage using the command crictl stats. This command displays the resource consumption for each container running on the node, allowing an administrator to take action to restore service using the methods described above.
In addition to manually intervening in managing node resources, you can leverage Admission Controllers and Eviction Policies to automate resource preservation. This approach does require additional resource configuration and tuning to run effectively in the cluster and this article will not address it.
Sometimes it makes sense to pat the cattle a bit
Being able to dispose of impacted cluster nodes and quickly recreate them is a great feature to have on your Kubernetes cluster. It assists support engineers with service restoration and meeting RTO and RPO objectives.
Resolution sometimes means treating these disposable hosts as pets and working through recurrent issues. The addition of a NodeSelector or taint/toleration can often resolve various problems in a Kubernetes ecosystem and crictl is a great option to dig in and understand the state of an impacted node in detail to plan these updates.
저자 소개

Dale has been part of Consulting at Deloitte since 2015. With over two decades of experience, Dale specializes in crafting secure and nationally significant cloud platforms. Leveraging expertise that pans architecture, design and delivery, with a focus on containerization, automation and DevOps.
Between deployments you'll find Dale knee-deep in the soil, dabbling in agriculture on the farm, or in the workshop, cooking up all kinds of cool stuff with 3D printing, wood and metal.
채널별 검색

오토메이션
기술, 팀, 인프라를 위한 IT 자동화 최신 동향

인공지능
고객이 어디서나 AI 워크로드를 실행할 수 있도록 지원하는 플랫폼 업데이트

오픈 하이브리드 클라우드
하이브리드 클라우드로 더욱 유연한 미래를 구축하는 방법을 알아보세요

보안
환경과 기술 전반에 걸쳐 리스크를 감소하는 방법에 대한 최신 정보

엣지 컴퓨팅
엣지에서의 운영을 단순화하는 플랫폼 업데이트

인프라
세계적으로 인정받은 기업용 Linux 플랫폼에 대한 최신 정보

애플리케이션
복잡한 애플리케이션에 대한 솔루션 더 보기

오리지널 쇼
엔터프라이즈 기술 분야의 제작자와 리더가 전하는 흥미로운 스토리
제품
- Red Hat Enterprise Linux
- Red Hat OpenShift Enterprise
- Red Hat Ansible Automation Platform
- 클라우드 서비스
- 모든 제품 보기
툴
체험, 구매 & 영업
커뮤니케이션
Red Hat 소개
Red Hat은 Linux, 클라우드, 컨테이너, 쿠버네티스 등을 포함한 글로벌 엔터프라이즈 오픈소스 솔루션 공급업체입니다. Red Hat은 코어 데이터센터에서 네트워크 엣지에 이르기까지 다양한 플랫폼과 환경에서 기업의 업무 편의성을 높여 주는 강화된 기능의 솔루션을 제공합니다.