

This is the first part of a blog series dedicated to explaining what this new tool is, and how the OpenShift PerfScale (Performance and Scalability) team uses it to perform scalability tests in OpenShift.
Wait, what is this kube-burner thing?
Kube-burner is a tool designed to stress different OpenShift components basically by coordinating the creation and deletion of k8s resources. Along this blog series we’ll talk about how to use it in OpenShift 4.
It’s worth saying that kube-burner have been designed to be compatible with vanilla kubernetes and other distributions, since all it needs is a Kubernetes API.
Kube-burner is a static compiled binary written in Golang, and makes an extensive usage of the client-go library to interact with the API.
$ kube-burner -h
Kube-burner 🔥

Tool aimed at stressing a kubernetes cluster by creating or deleting lots of objects.

Usage:
  kube-burner [command]

Available Commands:
  check-alerts Evaluate alerts for the given time range
  completion   Generates completion scripts for bash shell
  destroy  Destroy old namespaces labeled with the given UUID.
  help     Help about any command
  index    Index metrics from the given time range
  init     Launch benchmark
  version  Print the version number of kube-burner

Flags:
  -h, --help           help for kube-burner
   --log-level string   Allowed values: debug, info, warn, error, fatal (default "info")

Use "kube-burner [command] --help" for more information about a command.
The configuration kube-burner uses is described in YAML configuration files, these files describe the different actions to perform in the cluster, Prometheus metrics to collect and Prometheus expressions to evaluate (AKA alerting).
For example, a simple configuration file can look like:
---
global:
  writeToFile: true
  metricsDirectory: collected-metrics

jobs:
  - name: kube-burner-job
    jobIterations: 5
    qps: 20
    burst: 40
    namespacedIterations: true
    cleanup: true
    namespace: kube-burner-job-ns
    jobPause: 1s
    objects:

      - objectTemplate: objectTemplates/deployment.yml
        replicas: 1
Creating or deleting thousands of objects
As mentioned previously the main feature of Kube-burner is the ability to create or delete thousands of objects defined in a configuration file. These objects are created/deleted using a combination of loops+goroutines.
Within kube-burner exists the concept of jobIterations, which means the number of rounds a job will be executed, that is to say it will create as N-iterations of the objects described in the objects list.
Additionally, all declared objects in the list have the parameter replicas, which is configures the number of replicas of that object kube-burner will create in each iteration.
It’s important to note that kube-burner is able to perform namespaced iterations, meaning that each iteration will create a new namespace with the objects declared in the config. Otherwise, if this option is set to false all objects will be created within the same namespace.
The name of the namespaces that kube-burner will create is given by the parameter namespace, and in case of enabling the namespacedIterations parameter, it will append the number of the iteration after it. For example, let’s say we have a configuration like the following:
jobs:
- name: breaking-k8s
  jobIterations: 2
  namespace: breaking-k8s
  namespacedIterations: true
  objects:
  - objectTemplate: resource.yml
    replicas: 2
With this configuration. Kube-burner will create 2 namespaces named breaking-k8s-1 and breaking-k8s-2 with two replicas of the object declared in resource.yml
One of the best features kube-burner provides is the capability of configuring the rate the objects are created or deleted, this feature is determined by the parameters QPS and Burst (Which behaves similarly to k8s QPS and Burst parameters).
Kube-burner allows the user to pass variables to the object templates adding the parameters inputVars to the object, these variables are rendered using the default go-template library, so we can make use of the features this templating language provides:
kind: Pod
apiVersion: v1
metadata:
  name: {{.JobName}}-{{.Iteration}}
  labels:
    name: {{.JobName}}
spec:
  nodeSelector: {{ .nodeSelector}}
  containers:
  - name: {{.JobName}}
      image: {{.containerImage}}
      ports:
      - containerPort: {{.containerPort}}
         protocol: TCP
       imagePullPolicy: IfNotPresent
       securityContext:
          privileged: {{.privileged}}
Apart from the variables manually injected by inputVars, there are other variables that are always available to be used in all objectTemplates such as Iteration, Replica, JobName and UUID.
Collecting & indexing metrics
In addition to creating or deleting objects, kube-burner has a metric collection mechanism which leverages Prometheus to collect metrics. These metrics are defined in expressions provided by a metric-profile configuration file. They can be collected for benchmark time range using as start and end markers the duration of the benchmark itself, kube-burner CLI also provides an index subcommand that allows us to collect & index metrics for a specific time range without requiring to launch any benchmark.
For example, the following metric profile can be useful to collect some etcd related metrics:
metrics:
  - query: histogram_quantile(0.99, rate(etcd_disk_backend_commit_duration_seconds_bucket[2m]))
    metricName: 99thEtcdDiskBackendCommitDurationSeconds

  - query: histogram_quantile(0.99, rate(etcd_disk_wal_fsync_duration_seconds_bucket[2m]))
    metricName: 99thEtcdDiskWalFsyncDurationSeconds

  - query: histogram_quantile(0.99, rate(etcd_network_peer_round_trip_time_seconds_bucket[5m]))
    metricName: 99thEtcdRoundTripTimeSeconds
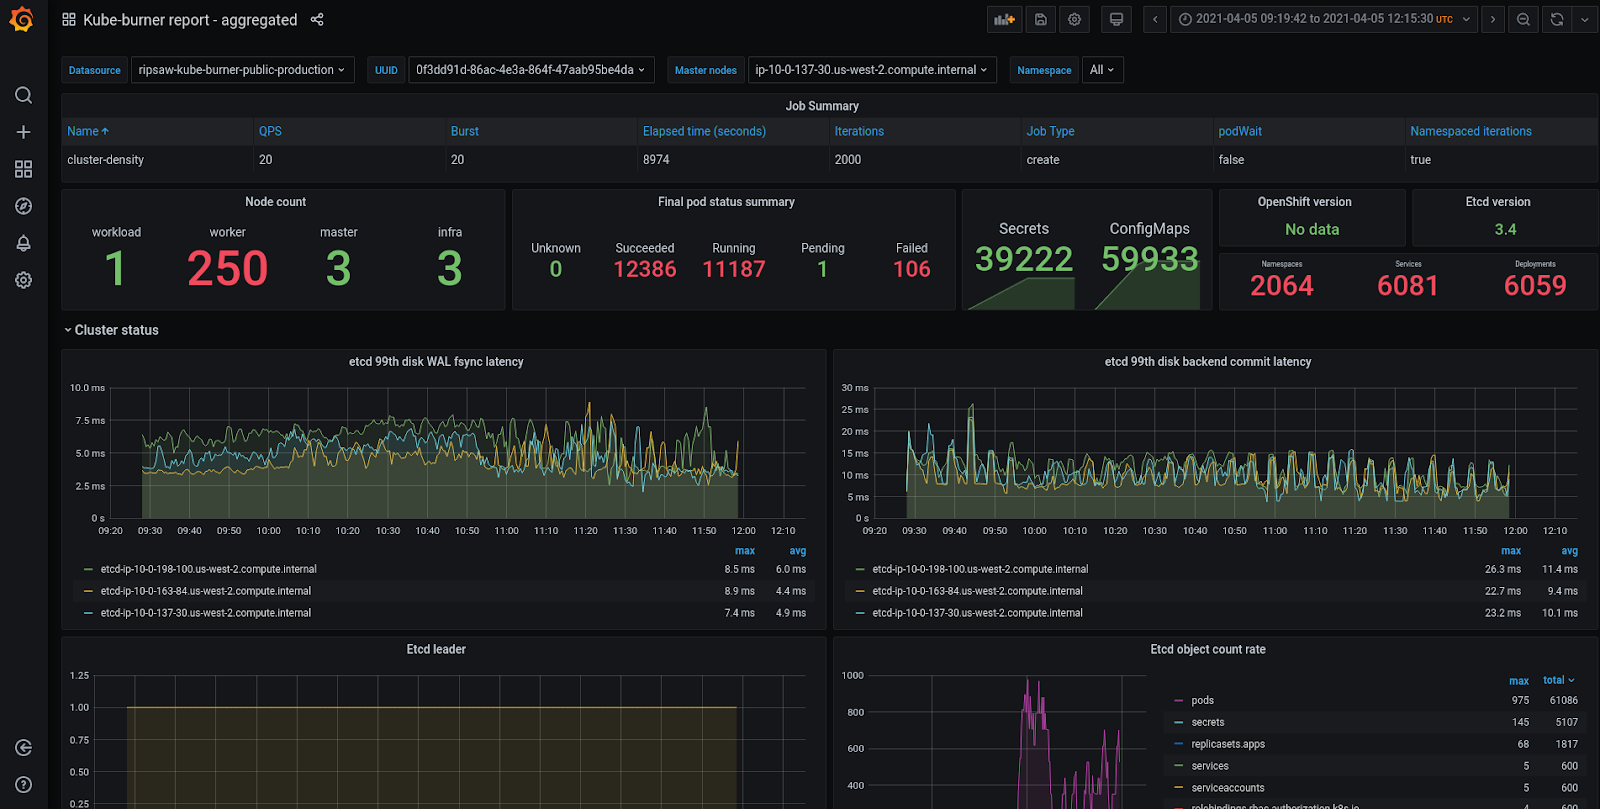
These metrics can be written to disk (In form of json file) or indexed to an external database, at the moment ElasticSearch is the only supported one. We, the OpenShift PerfScale team, are currently using grafana to represent these metrics we collect as shown in the screenshot below.
Alerting
Kube-burner includes an alert mechanism able to evaluate Prometheus expressions after the end of the latest Kube-burner's job. Similar to other features, these expressions are described in a YAML configuration file.
- expr: avg_over_time(histogram_quantile(0.99, rate(etcd_disk_wal_fsync_duration_seconds_bucket[2m]))[5m:]) > 0.01
  description: 5 minutes avg. etcd fsync latency on {{$labels.pod}} higher than 10ms {{$value}}
  severity: error

- expr: avg_over_time(histogram_quantile(0.99, rate(etcd_network_peer_round_trip_time_seconds_bucket[5m]))[5m:]) > 0.1
  description: 5 minutes avg. etcd network peer round trip on {{$labels.pod}} higher than 100ms {{$value}}
  severity: error
The code snippet below contains two alerts. Their prometheus expressions are configured by the expr field, the description field is used to raise a description of the alert once it raises. Last but not least, severity configures how kube-burner will behave in case of triggering an alert.
Kube-burner does not use Prometheus alerting system, as it uses its own expressions to evaluate metrics (those expressions could include prometheus alerts as well).
Apart from evaluating alerts raised during the duration of the benchmark, kube-burner has a specific check-alerts CLI option that allows to evaluate these expressions during a given time-range.
$ kube-burner check-alerts -u https://prometheus.url.com -t ${token} -a alert-profile.yml

INFO[2020-12-10 11:47:23] Setting log level to info                                                                                                                                                                                       INFO[2020-12-10 11:47:23] 👽 Initializing prometheus client

INFO[2020-12-10 11:47:24] 🔔 Initializing alert manager                                                                                                                                                                                  INFO[2020-12-10 11:47:24] Evaluating expression: 'avg_over_time(histogram_quantile(0.99, rate(etcd_disk_wal_fsync_duration_seconds_bucket[2m]))[5m:]) > 0.01'

ERRO[2020-12-10 11:47:24] Alert triggered at 2020-12-10 11:01:53 +0100 CET: '5 minutes avg. etcd fsync latency on etcd-ip-10-0-213-209.us-west-2.compute.internal higher than 10ms 0.010281314285714311'                                  INFO[2020-12-10 11:47:24] Evaluating expression: 'avg_over_time(histogram_quantile(0.99, rate(etcd_network_peer_round_trip_time_seconds_bucket[5m]))[5m:]) > 0.1'
Starting with kube-burner
In addition to the above, kube-burner also has other cool features such as object verification, golang pprof collecting , pod’s startup phase latency calculations and many more… we’ll talk about some of these features in future blog entries.
As mentioned above, Kube-burner is distributed as a binary, pre-compiled binaries for several architectures are available in the releases section of the project’s repository (https://github.com/cloud-bulldozer/kube-burner/releases).
In case you you want to run kube-burner on top of a k8s pod there’re also container images available with the latest Kube-burner bits hosted in quay https://quay.io/repository/cloud-bulldozer/kube-burner
You can find extensive documentation in it’s readthedocs site
저자 소개

채널별 검색

오토메이션
기술, 팀, 인프라를 위한 IT 자동화 최신 동향

인공지능
고객이 어디서나 AI 워크로드를 실행할 수 있도록 지원하는 플랫폼 업데이트

오픈 하이브리드 클라우드
하이브리드 클라우드로 더욱 유연한 미래를 구축하는 방법을 알아보세요

보안
환경과 기술 전반에 걸쳐 리스크를 감소하는 방법에 대한 최신 정보

엣지 컴퓨팅
엣지에서의 운영을 단순화하는 플랫폼 업데이트

인프라
세계적으로 인정받은 기업용 Linux 플랫폼에 대한 최신 정보

애플리케이션
복잡한 애플리케이션에 대한 솔루션 더 보기

오리지널 쇼
엔터프라이즈 기술 분야의 제작자와 리더가 전하는 흥미로운 스토리
제품
- Red Hat Enterprise Linux
- Red Hat OpenShift Enterprise
- Red Hat Ansible Automation Platform
- 클라우드 서비스
- 모든 제품 보기
툴
체험, 구매 & 영업
커뮤니케이션
Red Hat 소개
Red Hat은 Linux, 클라우드, 컨테이너, 쿠버네티스 등을 포함한 글로벌 엔터프라이즈 오픈소스 솔루션 공급업체입니다. Red Hat은 코어 데이터센터에서 네트워크 엣지에 이르기까지 다양한 플랫폼과 환경에서 기업의 업무 편의성을 높여 주는 강화된 기능의 솔루션을 제공합니다.