ようこそ、さん
Red Hat アカウントにログインする
Red Hat アカウントを使用すると、メンバープロファイルや設定、さらにお客様のステータスに応じて以下のサービスにアクセスできます。
- カスタマーポータル
- Red Hat Connect for Business Partners (パートナーセンター)
- ユーザーアカウント管理
- Certification Central
ぜひこの機会にご登録ください。ご登録いただくと、以下のことができるようになります。
- ナレッジベースの記事の閲覧、サポートケースとサブスクリプションの管理、更新のためのダウンロードなどをワンストップでご利用いただけます。
- お客様の組織のユーザーの確認、アカウント情報や設定、アクセスの許可などの編集が可能です。
- 認定資格の管理、受験履歴の確認、認定資格に関連したロゴや資料をダウンロードできます。
Red Hat アカウントを使用すると、メンバープロファイルや設定、さらにお客様のステータスに応じて以下のサービスにアクセスいただけます。
セキュリティ保護のため、共用のコンピュータからRed Hatサービスを利用する場合は、作業終了後に必ずログアウトしてください。
ログアウトRed Hat blog
Blog menu
OpenShift administrators often face the same challenges as other system administrators: "I need a tool that will monitor the health of my system." Yet, traditional monitoring tools often fall short in their visibility of an OpenShift cluster. Thus, a typical OpenShift monitoring stack includes Prometheus for systems as well as service monitoring, and Grafana for analyzing and visualizing metrics.
Often, administrators are looking to write custom queries and create custom dashboards in Grafana. However, the Grafana instance that is provided with the monitoring stack, along with its dashboards, is read-only. Enter the community-powered Grafana operator provided by OperatorHub.
Disclaimer: Community Operators are operators which have not been vetted or verified by Red Hat. Community Operators should be used with caution because their stability is unknown. Red Hat provides no support for Community Operators. In addition, customizing the Grafana instance in the monitoring stack as outlined below is explicitly unsupported by Red Hat.
I followed the steps below to deploy a community-powered Grafana on a running OpenShift 4.1 cluster. This allowed me to write custom queries against Prometheus to extract metrics relevant to me, and in turn create custom dashboards to visualize those metrics.
Deploying Custom Grafana
The community-powered Grafana cannot be deployed to the existing openshift-monitoring namespace, so we will create a new namespace (i.e. my-monitoring) to deploy into instead. Navigate to OperatorHub and select the community-powered Grafana Operator. Press Continue to accept the disclaimer, press Install, and press Subscribe to accept the default configuration values and deploy to the my-monitoring namespace. Within some time, the Grafana operator will be made available in the my-monitoring namespace.

From Installed Operators, select the Grafana Operator and press Create New Grafana to create a new Grafana instance.

In the Grafana instance YAML, make a note of the default username and password to log in, and press Create.
Connecting Prometheus to our Custom Grafana
The next step is to connect the existing Prometheus in the openshift-monitoring namespace with the community supported Grafana in the my-monitoring namespace. To do this, configure the prometheus-k8s StatefulSet to listen on all addresses, not just localhost. Navigate to Workloads -> StatefulSets, edit the YAML for the prometheus-k8s StatefulSet by changing '--web.listen-address=127.0.0.1:9090' to '--web.listen-address=:9090', and press Save:
spec:
  template:
    spec:
      containers:
        - name: prometheus
          args:
            - '--web.listen-address=:9090'
Customizing Grafana
From the my-monitoring namespace, navigate to Networking -> Routes and click on the Grafana URL to display the custom Grafana user interface. Click on ‘Sign In’ from the bottom left menu of Grafana, and log in using the default username and password configured earlier. Now, an editable Grafana interface appears.
Navigate to Configuration -> Data Sources from the menu, press Add Data Source, and select Prometheus. For the HTTP URL, type in http://prometheus-operated.openshift-monitoring.svc.cluster.local:9090 and you can leave the rest of the configuration values as default. Press Save and Test to confirm that Grafana is able to connect to the existing Prometheus data source.
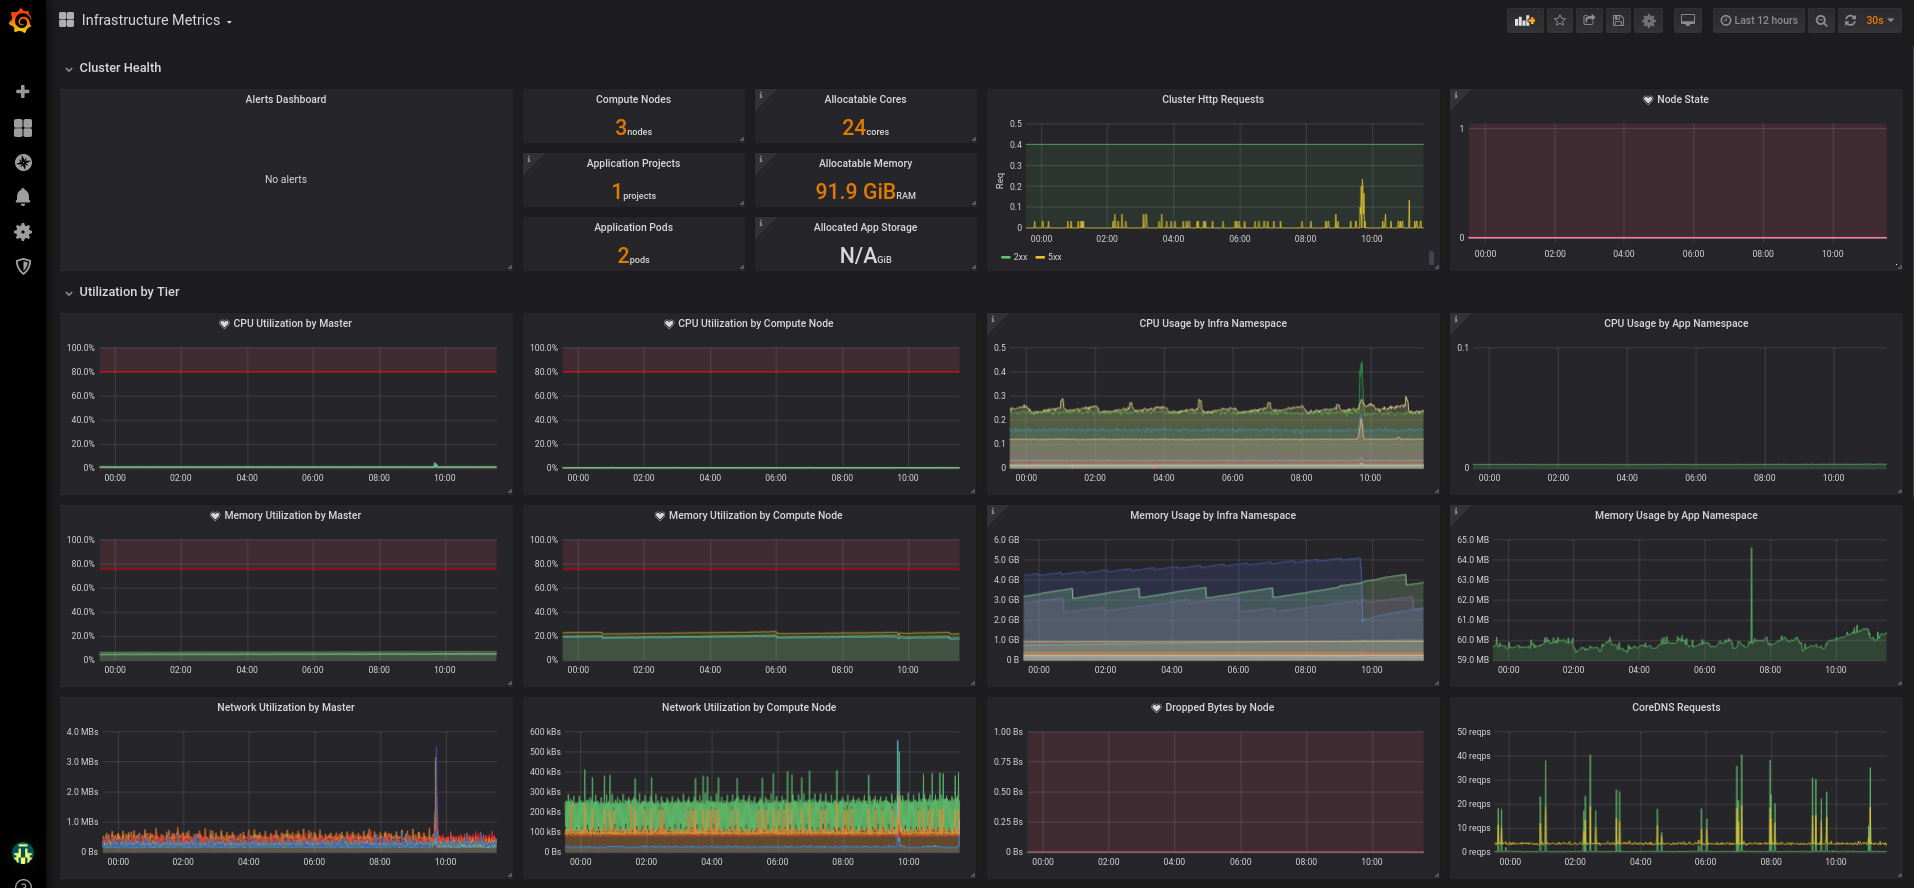
Finally, you can create or import a custom Grafana dashboard. I imported a custom Grafana dashboard from a JSON file in the screenshot below, which displayed the custom metrics I had been looking to view.

Summary
With the community-powered Grafana, an OpenShift administrator can now write their own Prometheus queries to extract metrics and create custom dashboards to visualize the data.

