In a world where we both need to focus on adapting new IT solutions and increasing operational efficiency, we need to start working smarter and more proactively.
With every Red Hat Enterprise Linux (RHEL) subscription, you get free access to Red Hat Insights, an advanced analytics service which greatly helps increase operational efficiency with very little effort. This blog entry is about how you can connect Red Hat Insights with your existing operational processes to help you work more proactively.
Short intro to Red Hat Insights
A large percentage of critical issues raised with Red Hat Support are already known to Red Hat or our partners. Among other things, Red Hat Insights provides the ability to automatically match your systems to these known problems and review suggested resolutions.
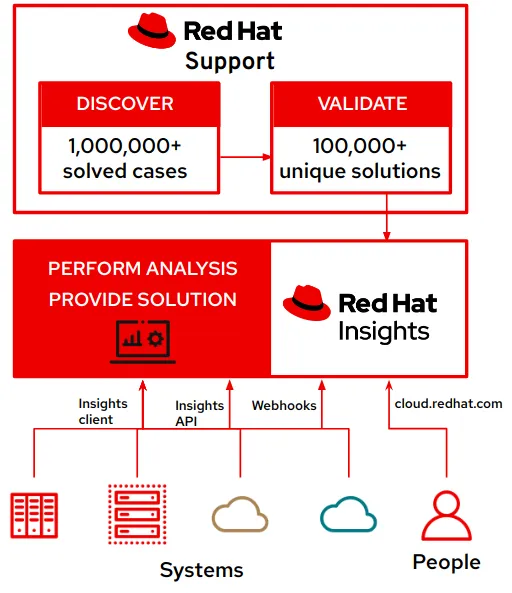
The matching process works by Red Hat Insights clients on your systems sending a small analysis package to cloud.redhat.com either via your Satellite server, a web proxy, or by direct connection. You can then triage and prioritize issues identified by Insights, and review information from the Advisor service via cloud.redhat.com or in Red Hat Satellite or Red Hat Ansible Tower.
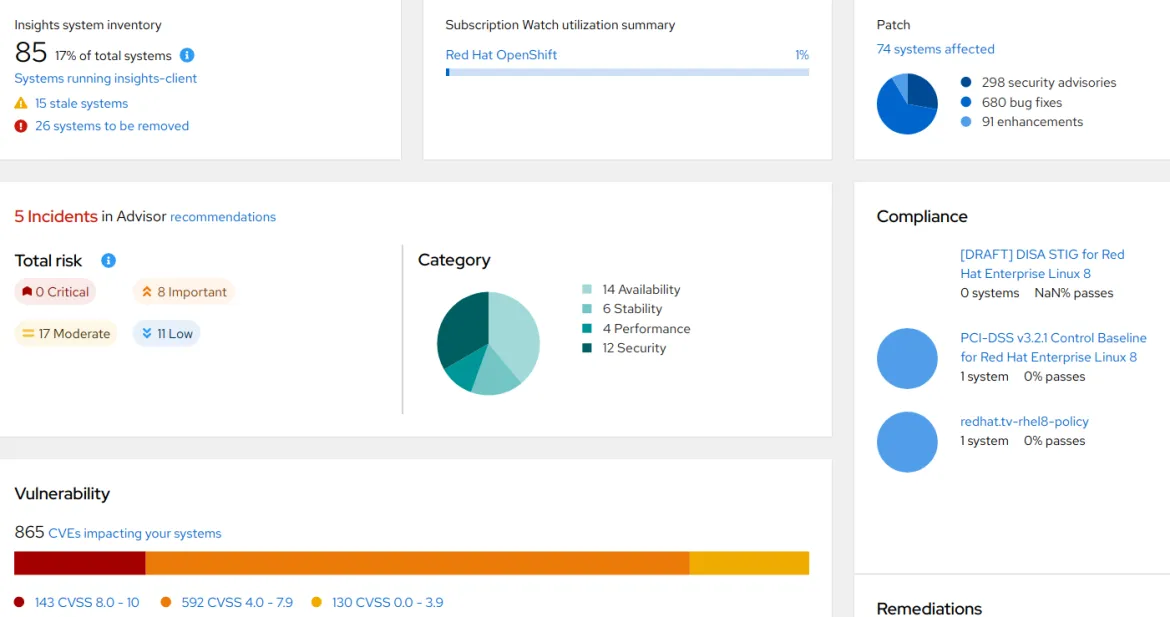
Integrating your monitoring system with Red Hat Insights
Note: the steps presented in this blog are not necessarily supported, as some functions (check-result and show-result) are being used outside their original scope.
Installing the Red Hat Insights client on your RHEL servers and starting to use isn’t too hard. With some effort, you can integrate it into your operational workflow. Useful information only displayed on a webpage tends to not be used 100% of the time. A way to help solve the issues identified by Red Hat Insights is to latch onto an existing operational process. One such process that is well established at most companies is the process that governs monitoring of IT systems. Let’s look into how we can connect your monitoring system with Red Hat Insights.
Once you have registered your system to Red Hat Insights, you can query which issues Red Hat Insights have identified for your system and display the result locally. You do so by running these commands:
# insights-client
This is the base Insights client command. If the system is already registered to Insights, running this command will generate a new metadata collection and send it to cloud.redhat.com for analysis.
# insights-client --check-result
This command will refresh the results from cloud.redhat.com on the host. Note that this command is currently undocumented.
# insights-client --show-result
This command will output the results from the --check-result command as JSON-formatted output.
Example output below:
[
 {
 "rule": {
   "rule_id": "decreased_vm_network_performance|VHOST_NET_KERNEL_MODULE_NOT_LOADED",
   "created_at": "2020-09-25T07:37:09.861713Z",
   "updated_at": "2020-09-28T01:30:43.910724Z",
   "description": "VM network performance is decreased when the vhost_net kernel feature is not enabled",
   "active": true,
   "category": {
    "id": 4,
    "name": "Performance"
   },
   "impact": {
    "name": "Network Performance Loss",
    "impact": 2
   },
   "likelihood": 4,
   "node_id": "",
   "tags": "kernel kvm networking performance rhel8 sbr_virtualization tuning vhost_net vm",
   "reboot_required": false,
   "publish_date": "2020-09-26T06:20:00Z",
   "summary": "VM network performance is decreased when the vhost_net kernel feature is not enabled.\n",
   "generic": "The `vhost_net` kernel module is used to accelerate the Host kernel using the `virtio-net` module. If it is **not loaded**, the VM network performance is decreased.\n",
   "reason": "This VM is running **RHEL{{=pydata.rhel_version}}** with the `vhost_net` kernel module disabled. As a result, VM network performance will be decreased.\n",
   "more_info": "For more information about Optimizing virtual machine network performance, refer to [Optimizing virtual machine network performance](https://access.redhat.com/documentation/en-us/red_hat_enterprise_linux/8/html/monitoring_and_managing_system_status_and_performance/optimizing-virtual-machine-performance-in-rhel-8_monitoring-and-managing-system-status-and-performance#optimizing-virtual-machine-network-performance_optimizing-virtual-machine-performance-in-rhel-8) section.\n",
   "resolution_set": [
    {
     "system_type": 105,
     "resolution": "Red Hat recommends that you enable the `vhost_net` kernel module:\n  ~~~\n  # modprobe vhost_net\n  ~~~\n\nAlternatively, you can persistently load the `vhost_net` kernel module on reboot:\n  ~~~\n  # echo vhost_net > /etc/modules-load.d/vhost_net.conf\n  ~~~\n",
     "resolution_risk": {
      "name": "Load Module",
      "risk": 1
     },
     "has_playbook": true
    }
   ],
   "total_risk": 3
  },
  "details": {
   "type": "rule",
   "error_key": "VHOST_NET_KERNEL_MODULE_NOT_LOADED",
   "rhel_version": "8.2"
  },
  "resolution": {
   "system_type": 105,
   "resolution": "Red Hat recommends that you enable the `vhost_net` kernel module:\n  ~~~\n  # modprobe vhost_net\n  ~~~\n\nAlternatively, you can persistently load the `vhost_net` kernel module on reboot:\n  ~~~\n  # echo vhost_net > /etc/modules-load.d/vhost_net.conf\n  ~~~\n",
   "resolution_risk": {
    "name": "Load Module",
    "risk": 1
   },
   "has_playbook": true
  }
 }
]
By creating a tool that reads this JSON, we can connect Red Hat Insights to a monitoring tool. Before we show an example of such an integration, let’s make a quick note of some items of interest for creating such an integration.
-
As of this writing, the show-result command only shows information from Insights Advisor, not about vulnerabilities or compliance or new software available.
-
Issues identified are organized into four categories: “Security,” “Availability,” “Stability” and “Performance”.
-
Total risk is a combination of likelihood of the issue and impact to remediate the issue.
-
Has_playbook identifies if Red Hat Insights has a ready-to-go Ansible playbook to remediate the issue. This playbook can be downloaded from the cloud.redhat.com user interface or via application programming interfaces (APIs). You won’t be able to generate the playbook from the command line of the client.
-
Requires_reboot tells us if we need to reboot the system to remediate the issue.This allows prioritization of issues which may not require downtime or coordination with other teams.
The most basic integration would be to simply look through identified issues and then trigger an alert if we pass N number of identified issues.
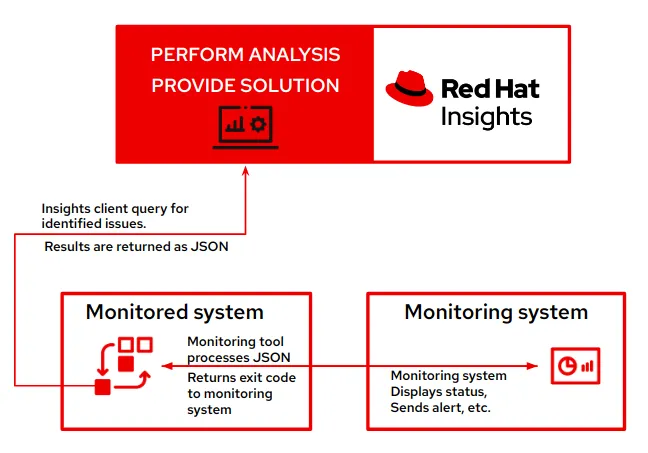 A proof of concept of such an integration can be found on this GitHub repository. The page describes how to use a simple Python script to process insights-client JSON output and notify monitoring solutions. A couple of examples are provided for running the script in different modes and configurations, specifically how to integrate with the widely popular open source monitoring system Nagios.
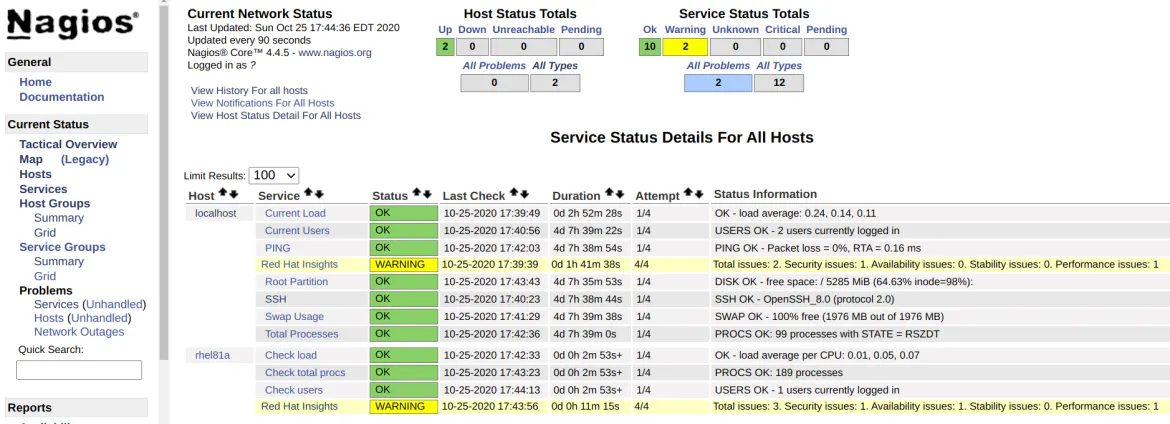
In the picture above, the proof of concept integration tool has sent exit code 1, which Nagios understands as “warning.”
Once we have integrated with our monitoring system, we can help to ensure that issues identified by Red Hat Insights are continuously acted on and resolved. This empowers operational processes that depend on monitoring, like checking for alerts before putting systems or releases into production or after performing patching.
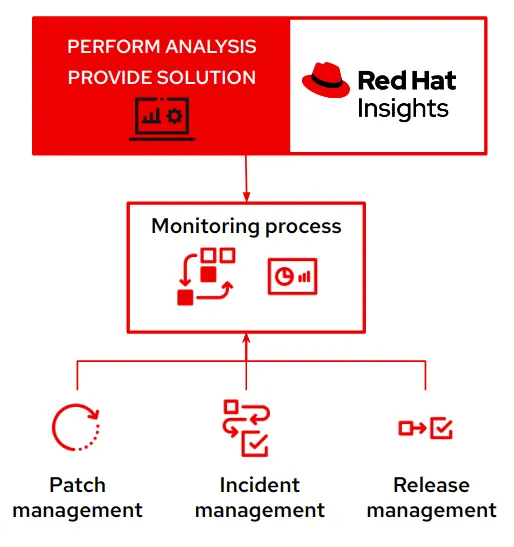
To conclude, in this post we looked at one of the options to integrate Red Hat Insights into your operational workflows, in particular how you can use the insights client to integrate with a monitoring system. For a more in-depth look at Red Hat Insights, check out our introductory blog post on its other capabilities.
執筆者紹介
Magnus Glantz is a Senior Solution Architect for Red Hat in EMEA.
チャンネル別に見る
自動化
テクノロジー、チームおよび環境に関する IT 自動化の最新情報
AI (人工知能)
お客様が AI ワークロードをどこでも自由に実行することを可能にするプラットフォームについてのアップデート
オープン・ハイブリッドクラウド
ハイブリッドクラウドで柔軟に未来を築く方法をご確認ください。
セキュリティ
環境やテクノロジー全体に及ぶリスクを軽減する方法に関する最新情報
エッジコンピューティング
エッジでの運用を単純化するプラットフォームのアップデート
インフラストラクチャ
世界有数のエンタープライズ向け Linux プラットフォームの最新情報
アプリケーション
アプリケーションの最も困難な課題に対する Red Hat ソリューションの詳細
オリジナル番組
エンタープライズ向けテクノロジーのメーカーやリーダーによるストーリー
製品
ツール
試用、購入、販売
コミュニケーション
Red Hat について
エンタープライズ・オープンソース・ソリューションのプロバイダーとして世界をリードする Red Hat は、Linux、クラウド、コンテナ、Kubernetes などのテクノロジーを提供しています。Red Hat は強化されたソリューションを提供し、コアデータセンターからネットワークエッジまで、企業が複数のプラットフォームおよび環境間で容易に運用できるようにしています。
言語を選択してください
Red Hat legal and privacy links
- Red Hat について
- 採用情報
- イベント
- 各国のオフィス
- Red Hat へのお問い合わせ
- Red Hat ブログ
- ダイバーシティ、エクイティ、およびインクルージョン
- Cool Stuff Store
- Red Hat Summit

