
Cerberus monitors OpenShift/Kubernetes cluster health and exposes a go/no-go signal consumable by other benchmark tools. Since introducing Cerberus in the first blog post (OpenShift Scale-CI: Part 4: Introduction to Cerberus - Guardian of Kubernetes/OpenShift Clouds), we have brought in a tremendous amount of enhancements to strengthen the guardian of the OpenShift/Kubernetes clusters. Cerberus has now evolved into a highly scalable and reliable tool with the potential to monitor diverse cluster components. In this blog post, we will be taking a look at all of the enhancements, the reasons we added them, and how the user will be able to use them.
Recent Additions to Monitoring
1: Schedulable MastersIt is essential to have dedicated resources for the master nodes in order to ensure high availability of key components such as API Server, Scheduler, Controller Manager, and etcd that always run on master nodes. Therefore, we need to avoid other noncritical workloads from interfering with the functioning of the master services. Taints enable a node to repel a set of pods from getting associated with it. Cerberus checks for masters without NoSchedule taint and warns the user regarding schedulable master nodes.
2: Cluster OperatorsOperators are pieces of software that run in a pod and are good indicators of unhealthy OpenShift clusters. These operators show multiple status, and we can look specifically at the degraded status to determine its overall health. With the OpenShift distribution set, Cerberus takes a look at all of the cluster operators and verifies that they aren’t degraded.
3: RoutesOpenShift should be able to have little or no downtime for a variety of different routes that control the cluster and expose the end user’s applications to the outside world. Being able to monitor how long these routes are down is an important component of a cluster's health. Now, the user has the ability to monitor multiple routes/urls to spot if they are down by providing authorization to access each route.
4: User-Defined ChecksThe user can bring in additional checks to monitor the components that are not being directly monitored by Cerberus such as checks to monitor status of application pods, database connectivity, and application server status and thus stepping up the significance and functionality of Cerberus.
5: Distributions supportedCerberus can run on Kubernetes and OpenShift distributions with a few tweaks to the configuration file. The user can select an appropriate configuration file based on the distribution. Using the OpenShift distribution runs both Kubernetes and OpenShift checks while the Kubernetes distribution examines the components specific to Kubernetes.
Improved Diagnostics
1: Cerberus Alerts on High Kube API Server LatenciesCerberus queries Prometheus if deployed for KubeAPILatencyHigh alert at the end of each iteration and warns the user if 99th percentile latency for given requests to the kube-apiserver is above 1 second. Higher latency is an indicator of problems in the cluster.
2: Cerberus History APIA single go/no-signal could miss flaky nodes, pods, and operators. History API is designed to provide adequate data enabling the user to decide if the cluster is healthy or not. Failures seen in a specific time window are provided to the user in the json format. It consists of information on the type of failure, name, and type of failed component and includes a timestamp when the failure occurred.
- Users can retrieve the node/component failures seen in the past one hour by visiting the history url. Users can pass an optional loopback parameter to retrieve failures seen in the past loopback minutes.
- Users can retrieve the node/component failures between two time timestamps, failures of specific types and failures related to specific components in json format by visiting the analyze url. The user gets the privilege to apply filters to scrape the failures satisfying certain criteria.
History API is available as a Python package to ease the usage in other tools.
Cerberus Scalability
Cerberus is a highly scalable and reliable tool with the ability to monitor the health of 500-plus node clusters in a matter of seconds. Following enhancements were added to boost the scalability:
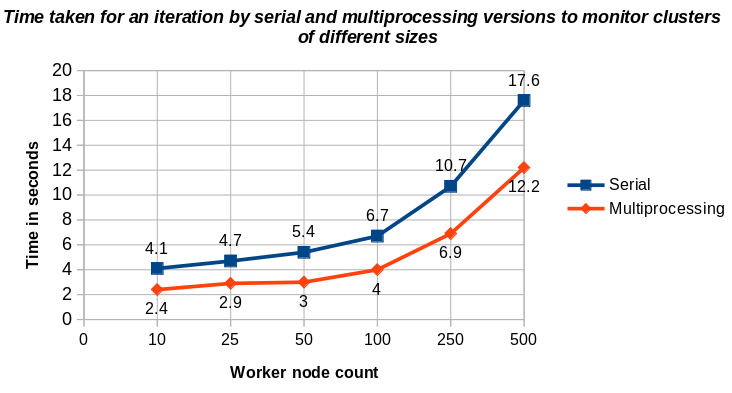
1: MultiprocessingCerberus uses multiple cores to reduce the cluster monitoring time.
- It performs all cluster health checks in parallel.
- It monitors the system critical and application components in all namespaces in parallel.
- It tracks pod crash/restart during wait time between iterations in all namespaces in parallel.
- It collects detailed logs, metrics, and events of failed components in parallel.
The graph below shows the time comparisons of health monitoring time by a single process/serial and multiprocessing versions of Cerberus on clusters of different size.
Cerberus makes a single API call to get the status of all the pods in a namespace instead of iterating through the list of pods and making an API call to get the status of each pod. Similarly, a single API call is used to get the status of all the nodes. Cerberus handles bulk requests in chunks to prevent overloading the API Server by consuming a large amount of resources when there are thousands of objects running in a cluster.
Cerberus Reliability
Cerberus is a highly reliable tool with ability to generate go/no-go signals under scenarios like cluster connection loss, cluster shut down, etcd leader change, rpc error, etc. It has the potential to monitor cluster health till the user terminates Cerberus monitoring.
New Ways on How to Get Started
1: Cerberus python packageCerberus is available as a Python package to ease the installation and usage.
2: Cerberus as a Kubenetes Deployment
Cerberus can be run internally to the cluster as a Kubernetes deployment. However, it is not a recommended option as the pod which is running Cerberus might get disrupted. It is advised to run Cerberus external to the cluster to ensure the receipt of a go/no-go signal is not affected when the cluster is down, Kube API stops serving requests, etc.
Demo
https://drive.google.com/file/d/1urYSeVW60xxPc_s5ZxPE5ddriSS2M8zX/view?usp=sharing
We are always looking for new ideas and enhancements to this project. Feel free to create issues on github or open your own pull request for future improvements you would like to see. Also, reach out to us with any questions, concerns or need help on slack.
{{cta('1ba92822-e866-48f0-8a92-ade9f0c3b6ca')}}
執筆者紹介

チャンネル別に見る

自動化
テクノロジー、チームおよび環境に関する IT 自動化の最新情報

AI (人工知能)
お客様が AI ワークロードをどこでも自由に実行することを可能にするプラットフォームについてのアップデート

オープン・ハイブリッドクラウド
ハイブリッドクラウドで柔軟に未来を築く方法をご確認ください。

セキュリティ
環境やテクノロジー全体に及ぶリスクを軽減する方法に関する最新情報

エッジコンピューティング
エッジでの運用を単純化するプラットフォームのアップデート

インフラストラクチャ
世界有数のエンタープライズ向け Linux プラットフォームの最新情報

アプリケーション
アプリケーションの最も困難な課題に対する Red Hat ソリューションの詳細

オリジナル番組
エンタープライズ向けテクノロジーのメーカーやリーダーによるストーリー
製品
ツール
試用、購入、販売
コミュニケーション
Red Hat について
エンタープライズ・オープンソース・ソリューションのプロバイダーとして世界をリードする Red Hat は、Linux、クラウド、コンテナ、Kubernetes などのテクノロジーを提供しています。Red Hat は強化されたソリューションを提供し、コアデータセンターからネットワークエッジまで、企業が複数のプラットフォームおよび環境間で容易に運用できるようにしています。
言語を選択してください
Red Hat legal and privacy links
- Red Hat について
- 採用情報
- イベント
- 各国のオフィス
- Red Hat へのお問い合わせ
- Red Hat ブログ
- ダイバーシティ、エクイティ、およびインクルージョン
- Cool Stuff Store
- Red Hat Summit