
Last October, we announced the developer preview of power monitoring for Red Hat OpenShift, unveiling Kepler as an integral component of the sustainable-computing upstream community initiative. This initiative enables early adopters to experiment with this promising technology. Since the announcement, our team has been working hard to build pipelines and tooling that meet Red Hat's product security and testing standards.
Today, we are excited to share a new milestone in our journey – the Technology Preview release of power monitoring for Red Hat OpenShift. A heartfelt thank you goes out to all early adopters and disruptive technology lovers who have actively participated in deploying power monitoring and generously shared invaluable feedback.
For those who haven’t had the chance to experiment with power monitoring for Red Hat OpenShift, it is a set of tools that enables you to monitor the power consumption of workloads running in an OpenShift cluster. This information can be leveraged for various purposes, such as pinpointing the most power-intensive namespaces or formulating a strategic plan to minimize energy consumption.
If you’re interested in experimenting with this preview release, we have provided details below on how to get started. Please read the Technology Preview statement for further information about official support.
Installing power monitoring for Red Hat OpenShift
We aim to provide a unified experience, and as such, these installation steps closely resemble those of the previous version of power monitoring that relied on the community operator.
- Enable user-workload-monitoring by following the instructions provided in the Red Hat OpenShift documentation.
- To avoid unnecessary conflicts, first uninstall any old version of kepler-operator that you could have installed through the community operators catalog.
- Install the Operator from the OpenShift 4.14 (and above) console by navigating to Operators -> OperatorHub. Then, use the search box to find power monitoring for Red Hat OpenShift, click on it and press the “Install” box.
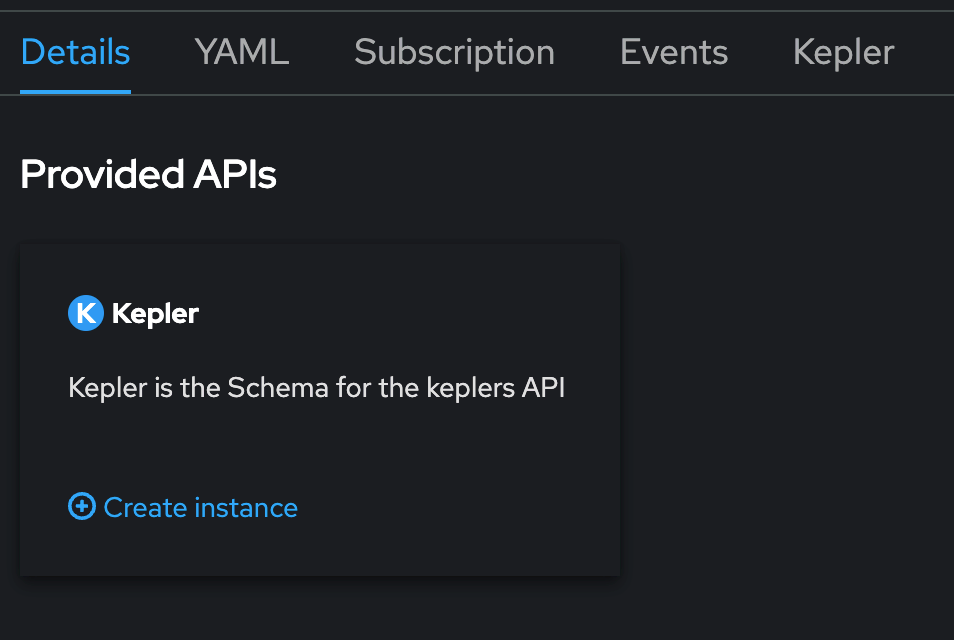
- Once the Operator gets installed, create an instance of the Kepler Custom Resource Definition by clicking on “View Operator” and, after that, clicking on “Create instance” under the Kepler API.
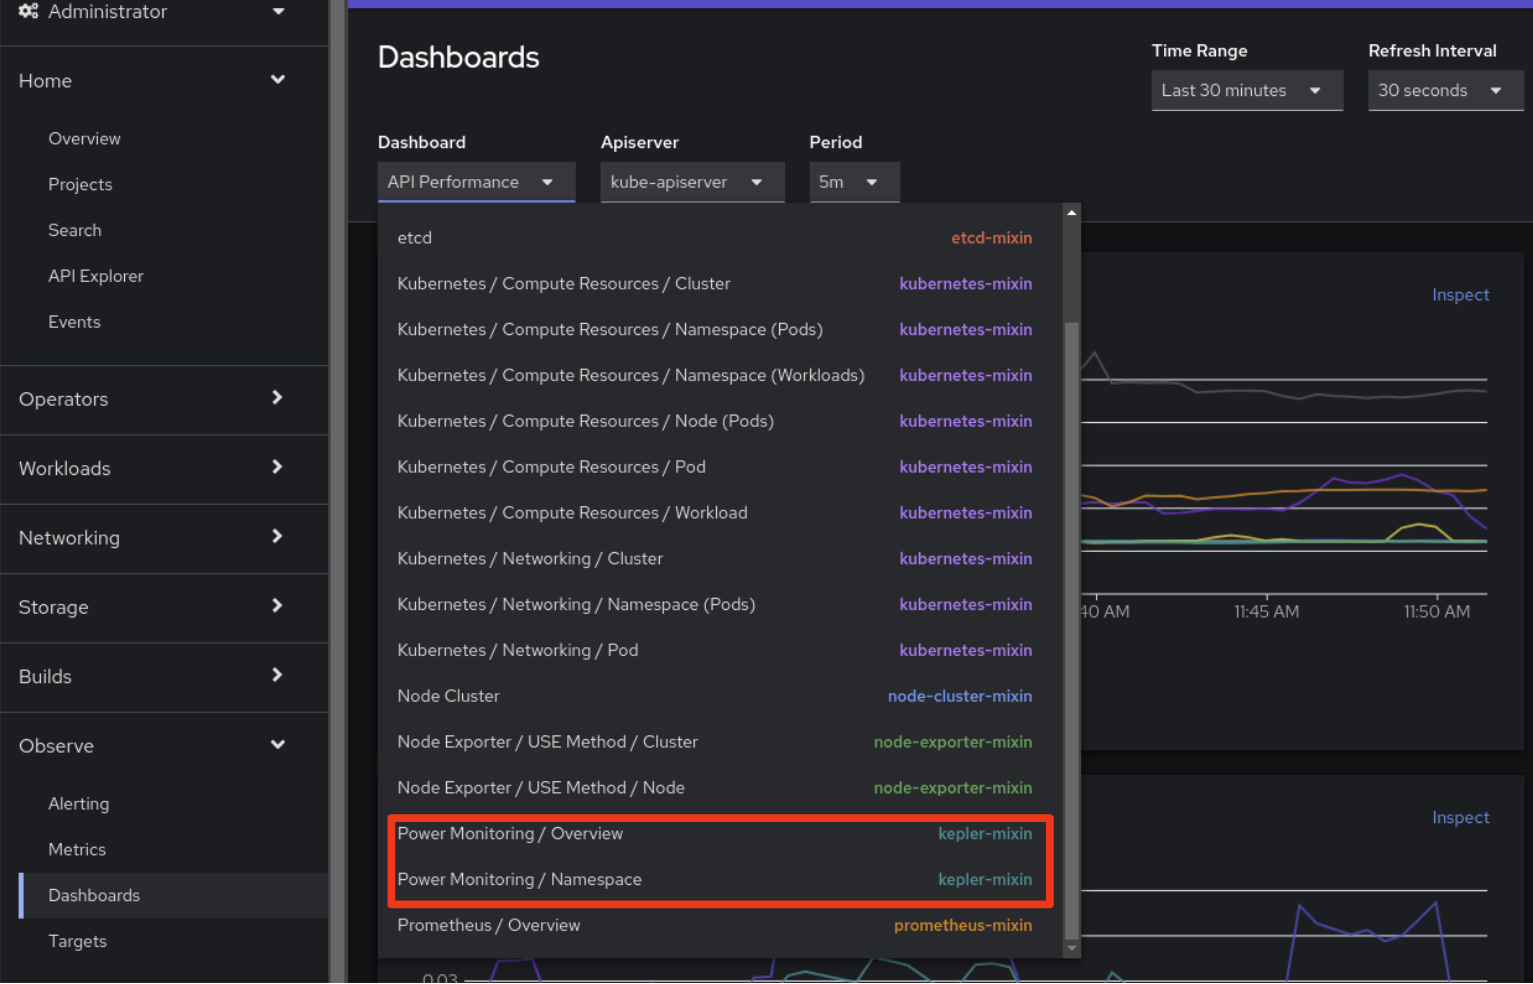
Done. Once Kepler is installed, two new dashboards will be available under the Observe>Dashboards UI tab from the OpenShift Console:
To get more information about power monitoring, users are strongly encouraged to read the power monitoring official documentation under the OpenShift docs.
The power of monitoring
By using these dashboards you can now gain the following insights about the cluster and its workloads:
- Monitor the total energy consumed in your cluster during the last 24 hours, including an indication of the selected CPU architecture and number of monitored nodes.
- See a breakdown of the top power consuming namespaces.
- Understand which containers and pods are consuming the most amount of power. This can be achieved by analyzing those metrics exposed by Kepler under the “Observe -> Metrics” tab.
- Pro tip: you can query all available metrics of power monitoring by using this regular expression: { __name__ =~ "kepler.+"}
As mentioned earlier, the incorporation of Kepler into OpenShift makes these metrics available. The set of metrics obtained by Kepler depends heavily on the underlying hardware and cluster configuration. Presently, Kepler provides accurate measurements from a specific set of cloud configurations, specifically those based on Intel hardware able to expose Running Average Power Limit (RAPL) and Advanced Configuration and Power Interface (ACPI) in Bare Metal deployments.
For other configurations, an initial machine learning model is provided, and Red Hat is working with the broader community to further improve the accuracy of machine learning based estimators. Currently, these estimates exhibit consistency, allowing you to rely on them to show variations between runs of the same workload. However, it’s important to note that they are approximations of the actual power consumption.
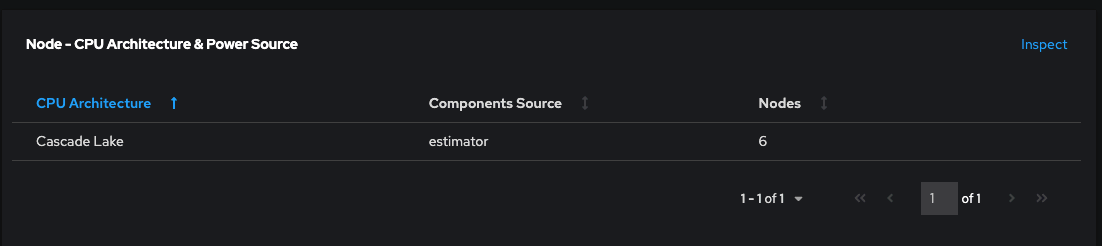
To make it easier for our users to understand whether Kepler is providing metric-based values or model-based values as a default, we have added an extra column called "Components Source" in the Node - CPU Architecture panel under the Overview page.
This enhancement provides transparency, allowing users to see where these metrics are coming from, such as rapl-sysfs or rapl-msr. If Kepler cannot obtain hardware power consumption metrics, it will display “estimator” as the source instead. In such instances, Kepler falls back to the machine learning model and the resulting aforementioned estimators. Ongoing development efforts are focused on refining these models to enhance both accuracy and the scope of footprints they can address.
Exploring the metrics
So, what does it look like? Let’s deep dive with an example. After installing Kepler by following the official documentation, we installed an HTTP/2 traffic generator and a mock, and put a bit of load into the system.
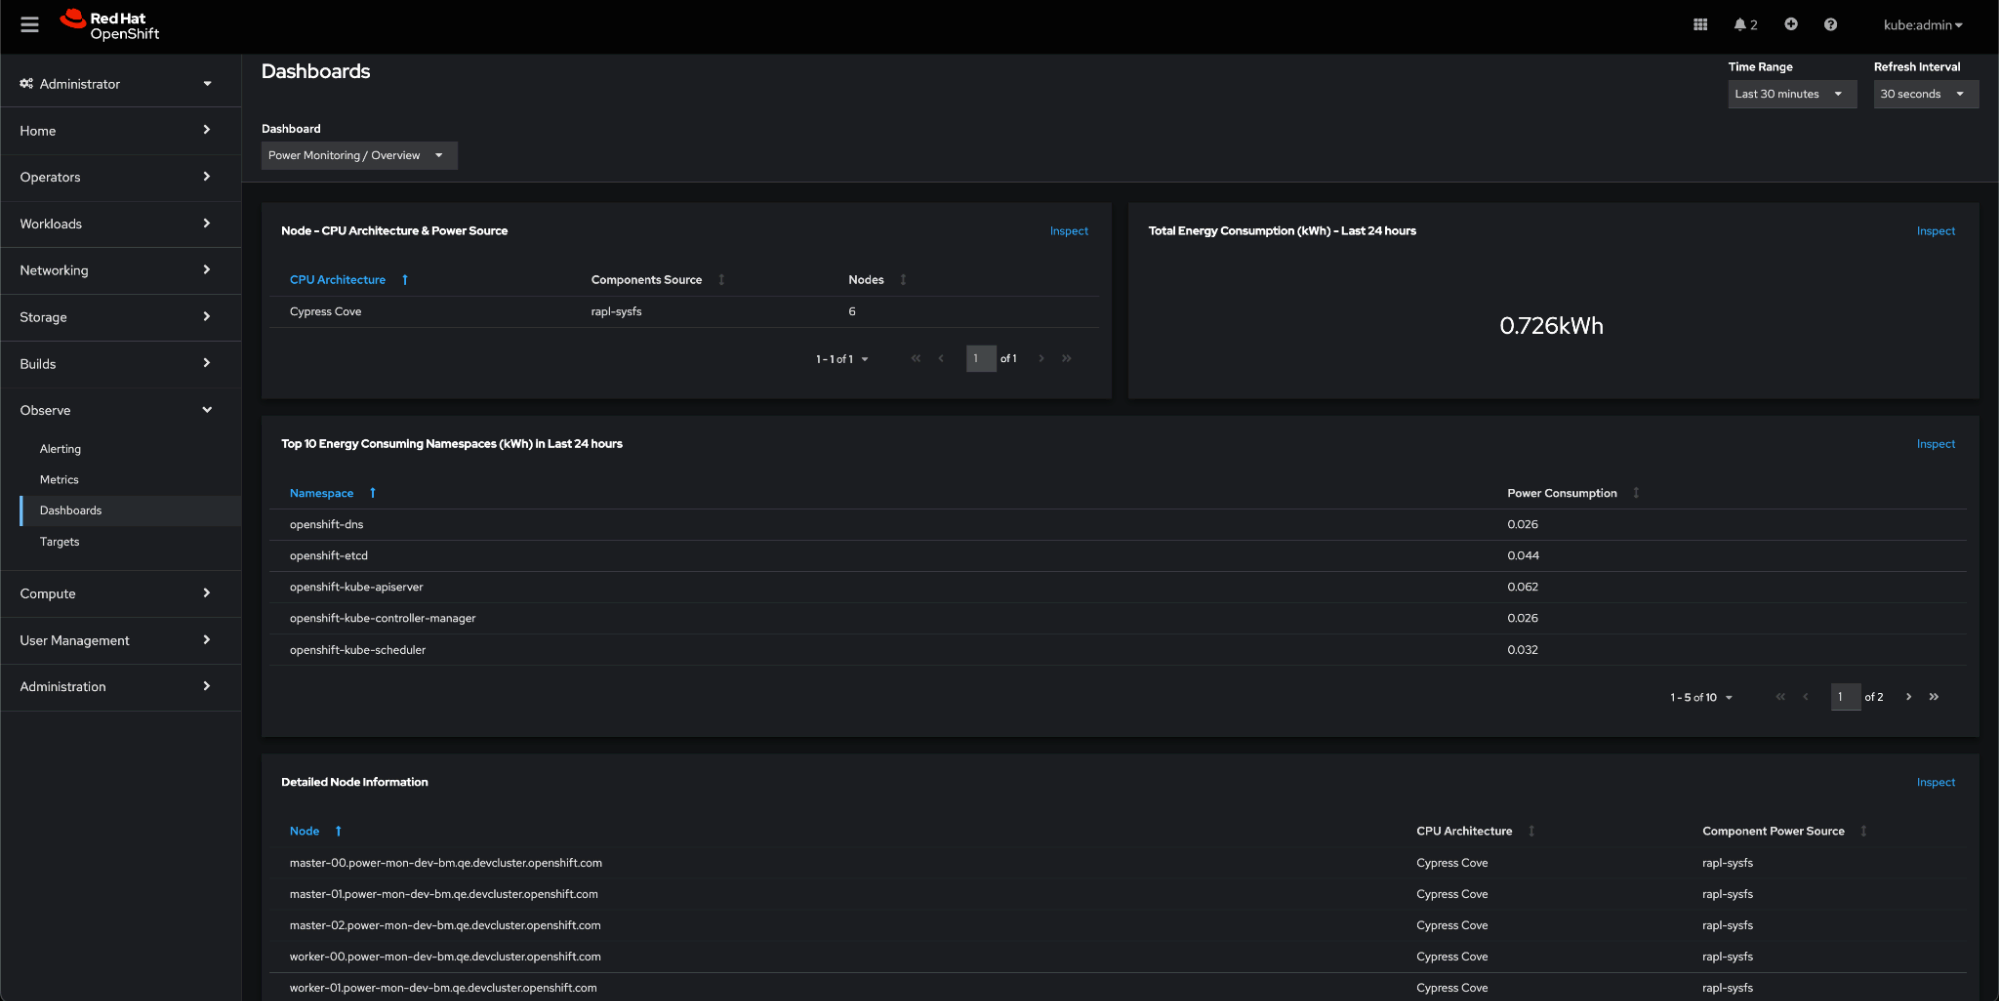
Now, let’s see the power consumption impact on our OpenShift cluster. Navigating to the Observe -> Dashboards -> Power Monitoring Overview dashboard in the OpenShift console, we can see now that:
- Nodes shown in the Architecture panel are reporting metrics-based results, as it shows rapl-sysfs in the Components Source column.
- The cluster has been up for a while, but idle, so it has not consumed so much kWh.
- A list of the namespaces that contribute the most to the energy bill is also shown.
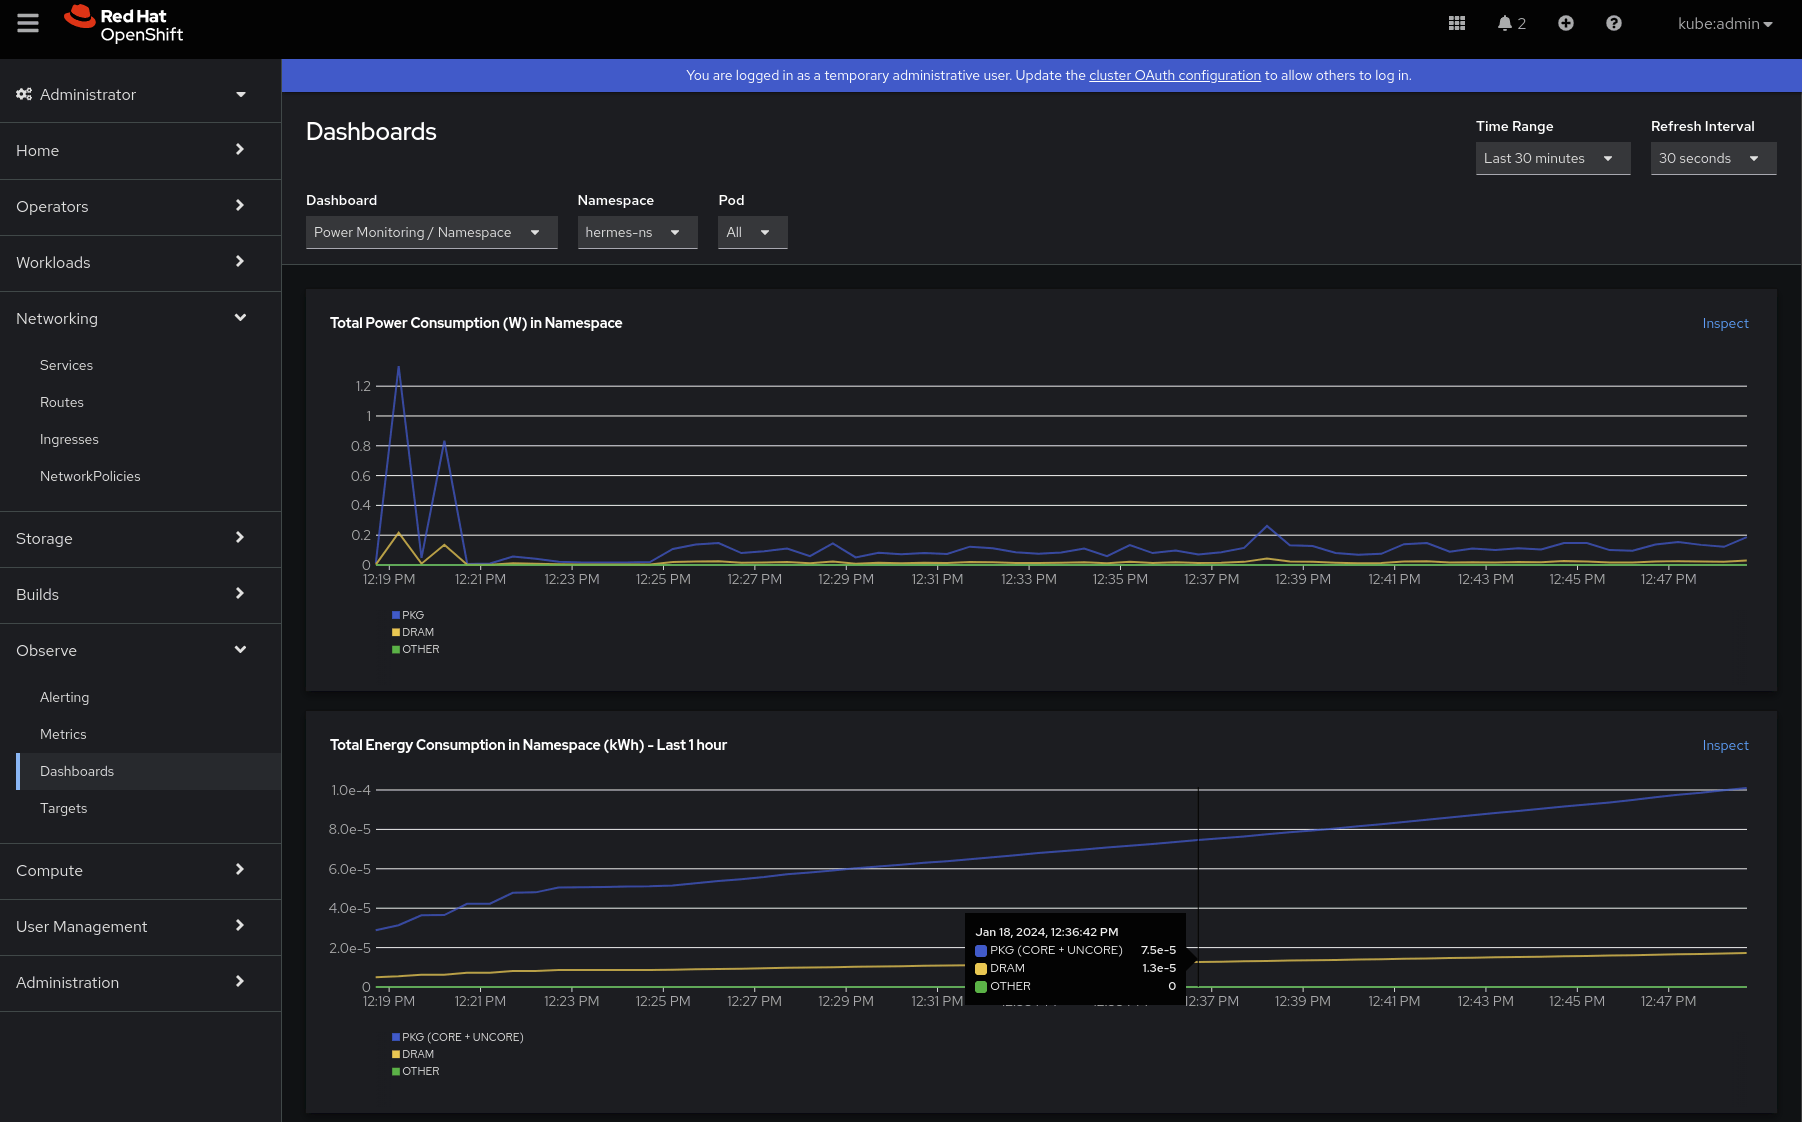
What else? We want to understand the power and energy consumption profiles so let’s dive jump into the second dashboard: “Power Monitoring / Namespace.” After selecting our namespace of interest (hermes-ns):
- The first thing which can be observed is that, after a couple of peaks, the power consumption in watts is steady over time, and the top contributor to it is the PKG component. Package (PKG) domain measures the energy consumption of the entire socket. It includes the consumption of all the cores, integrated graphics and also the uncore components (last level caches, memory controller). This seems right, and no accumulations are found, since power consumption is the rate of the energy.
- We can also see that the energy consumption is increasing over time. The power contribution of DRAM (which measures the energy consumption of RAM attached to the integrated memory controller) seems negligible in this case.
Scrolling down a bit, we can further analyze, per container, the contributions for both PKG and DRAM. The first thing that catches our eye is that the first peaks seem to be caused by a previous workload. That sounds interesting, and we might need to debug it in our app/mock!
After the second deployment is ready, we can observe that both containers contribute equally to the power consumption.
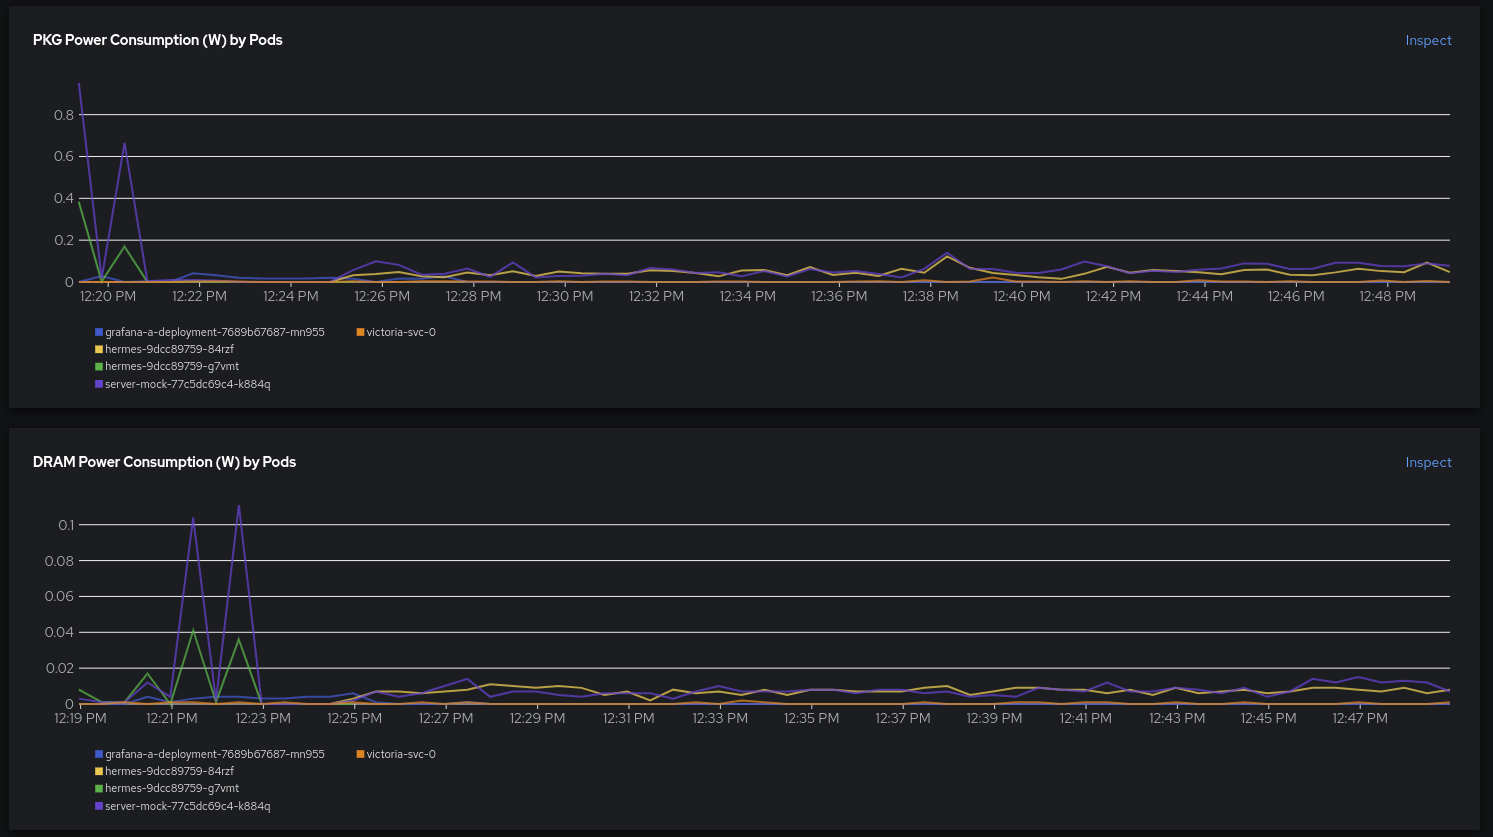
What is this telling us? Does it mean that a traffic generator with some sort of complex logic and instrumentalization with OpenTelemetry, metrics, and traces is consuming the same amount of energy as a simple mock that just says “200 OK” and prints it to the console? While we love modern observability, one still does need to do a print to the standard output from time to time.
func exampleHandler(w http.ResponseWriter, r *http.Request) {
	time.Sleep(2 * time.Millisecond)
	fmt.Println("Request received. URI:", r.RequestURI, "Method:", r.Method)
	w.WriteHeader(200)
}
The traffic generator is written in C++, and the mock in Go. Recent studies have shown that C++ can be more energy efficient than Go under certain conditions by a factor of 2.5, but that discussion is far beyond the scope of this blog. We love every language, and each of them has its own areas in which to thrive. We can’t wait to see how you will use power monitoring. Perhaps you can even wade into the programming language/power consumption wars with your own data in hand.
What’s next?
We remain committed to incorporating your feedback, making adjustments, and introducing enhancements. Our collaboration with the community will persist, contributing to the global initiative to more effectively monitor energy consumption. The outlook is promising, with potential plans ranging from integrating power monitoring with broader sustainability initiatives to aiding developers in observing their code within the OpenShift platform or exporting data through OpenTelemetry.
Further reading
- Red Hat OpenShift official documentation
- Introducing developer preview of Kepler: power monitoring for Red Hat OpenShift
- https://sustainable-computing.io/
- Exploring Kepler’s potentials: unveiling cloud application power consumption | CNCF
- Which Programming Languages Use the Least Electricity? - The New Stack
- Developer Preview Support Scope - Red Hat Customer Portal
- Technology Preview Features - Scope of Support - Red Hat Customer Portal
- Developer and Technology Previews: How they compare - Red Hat Customer Portal
- Enabling monitoring for user-defined projects | Monitoring | Red Hat OpenShift Platform 4.14
저자 소개

Jose is a Senior Product Manager at Red Hat OpenShift, with a focus on Observability and Sustainability. His work is deeply related to manage the OpenTelemetry, distributed tracing and power monitoring products in Red Hat OpenShift.
His expertise has been built from previous gigs as a Software Architect, Tech Lead and Product Owner in the telecommunications industry, all the way from the software programming trenches where agile ways of working, a sound CI platform, best testing practices with observability at the center have presented themselves as the main principles that drive every modern successful project.
With a heavy scientific background on physics and a PhD in Computational Materials Engineering, curiousity, openness and a pragmatic view are always expected. Beyond the boardroom, he is a C++ enthusiast and a creative force, contributing symphonic and electronic touches as a keyboardist in metal bands, when he is not playing videogames or lowering lap times at his simracing cockpit.
채널별 검색

오토메이션
기술, 팀, 인프라를 위한 IT 자동화 최신 동향

인공지능
고객이 어디서나 AI 워크로드를 실행할 수 있도록 지원하는 플랫폼 업데이트

오픈 하이브리드 클라우드
하이브리드 클라우드로 더욱 유연한 미래를 구축하는 방법을 알아보세요

보안
환경과 기술 전반에 걸쳐 리스크를 감소하는 방법에 대한 최신 정보

엣지 컴퓨팅
엣지에서의 운영을 단순화하는 플랫폼 업데이트

인프라
세계적으로 인정받은 기업용 Linux 플랫폼에 대한 최신 정보

애플리케이션
복잡한 애플리케이션에 대한 솔루션 더 보기

오리지널 쇼
엔터프라이즈 기술 분야의 제작자와 리더가 전하는 흥미로운 스토리
제품
- Red Hat Enterprise Linux
- Red Hat OpenShift Enterprise
- Red Hat Ansible Automation Platform
- 클라우드 서비스
- 모든 제품 보기
툴
체험, 구매 & 영업
커뮤니케이션
Red Hat 소개
Red Hat은 Linux, 클라우드, 컨테이너, 쿠버네티스 등을 포함한 글로벌 엔터프라이즈 오픈소스 솔루션 공급업체입니다. Red Hat은 코어 데이터센터에서 네트워크 엣지에 이르기까지 다양한 플랫폼과 환경에서 기업의 업무 편의성을 높여 주는 강화된 기능의 솔루션을 제공합니다.