
![]()
In today's interconnected digital landscape, Domain Name System (DNS) tracking plays a crucial role in networking and security. DNS resolution is a fundamental process that translates human-readable domain names into IP addresses, enabling communication between devices and servers. Depending on how it is configured and manipulated, it can also be a security vulnerability and a tool for firewalling and blocking access to content. DNS resolution benefits from monitoring and analysis for operations excellence, which can be achieved through innovative technologies like eBPF (extended Berkeley Packet Filter).
This blog post delves into the world of DNS tracking using eBPF tracepoint hooks, exploring how this powerful combination can be used for various purposes, including network monitoring and security enhancement.
Understanding DNS resolution
Before diving into the specifics of eBPF tracepoint hooks, here is a brief recap on how DNS resolution works. In a Kubernetes architecture, DNS is critical in enabling communication between various components and services within the cluster. Kubernetes uses DNS to facilitate service discovery and resolve domain names to the corresponding IP addresses of pods or services. This process involves multiple steps, including querying DNS servers, caching responses, obtaining the IP address to establish a connection, and caching answers for future re-occurrence of the same DNS query.
Utilizing tracepoint hooks for DNS tracking
Tracepoint hooks are predefined points in the Linux kernel where eBPF programs can be attached to capture and analyze specific events. We leveraged tracepoint hooks associated with DNS resolution processes for DNS tracking, specifically the tracepoint/net/net_dev_queue tracepoint. Then, we parse the DNS header to determine if it is a query or a response, attempt to correlate the query or response with a specific DNS transaction, and then record the elapsed time to compute DNS latency. Furthermore, DNS network flows are enriched with DNS-related fields (id, latency, and response codes) to help build graphs with aggregated DNS statistics and filtering on specific fields for display in the Network Observability console.
Potential use cases
DNS tracking with eBPF tracepoint hooks can serve various purposes:
- Network Monitoring: Gain insights into DNS queries and responses, helping network administrators identify unusual patterns, potential bottlenecks, or performance issues.
- Security Analysis: Detect suspicious DNS activities, such as domain name generation algorithms (DGA) used by malware, or identify unauthorized DNS resolutions that might indicate a security breach.
- Troubleshooting: Debug DNS-related issues by tracing DNS resolution steps, tracking latency, and identifying misconfigurations.
How to enable DNS tracking
By default, DNS tracking is disabled because it requires privileged access. To enable this feature, create a flow collector object with the following fields enabled in the eBPF config section as shown below:
apiVersion: flows.netobserv.io/v1beta1
kind: FlowCollector
metadata:
  name: cluster
spec:
  agent:
    type: EBPF
    ebpf:
      privileged: true
      features:
        - DNSTracking
A quick tour of the UI
Once the DNSTracking feature is enabled, the Console plugin will automatically adapt to provide additional filters and show information across views.
Open your OCP Console and move to Administrator view -> Observe -> Network Traffic page as usual.
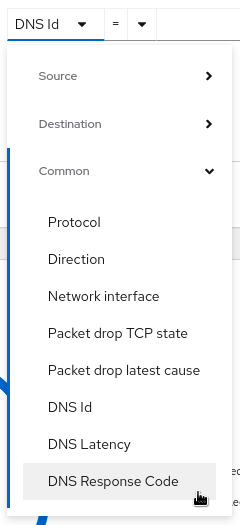
Three new filters, DNS Id, DNS Latency, and DNS Response Code, will be available in the common section:
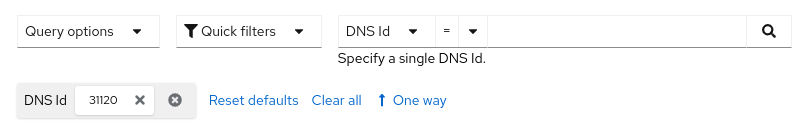
The first option allows you to filter on a specific DNS Id (found using the dig command or flow table details) to correlate with your query:
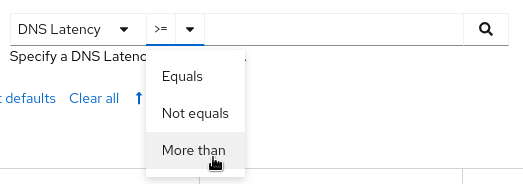
The second choice helps identify potential performance issues by looking at DNS resolution latency:
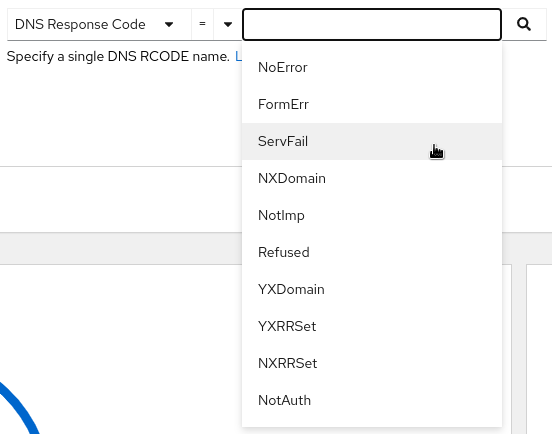
The third filter surfaces DNS response codes, which can help detect errors or unauthorized resolutions:
Overview
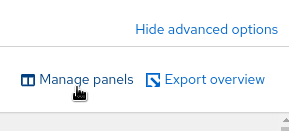
New graphs are introduced in the advanced options -> Manage panels popup:
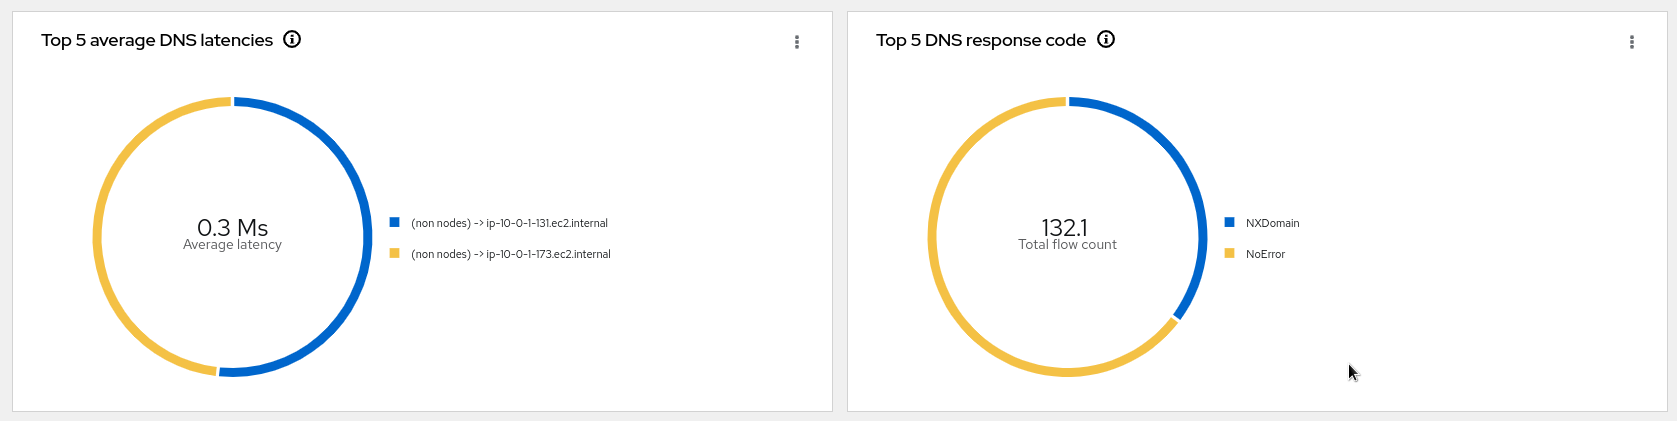
- Top X average DNS latencies
- Top X DNS response code
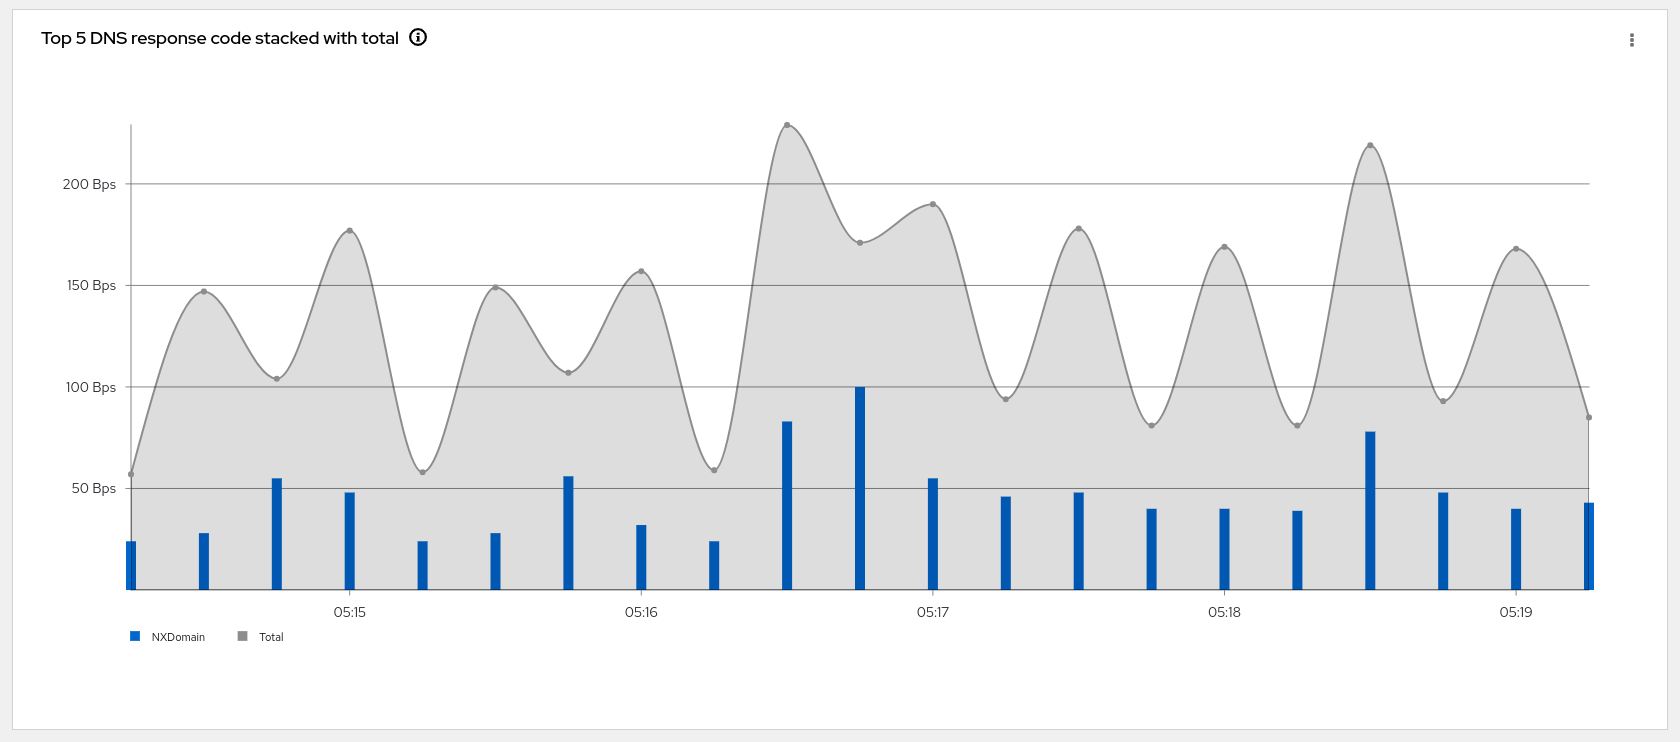
- Top X DNS response code stacked with total
Traffic flows
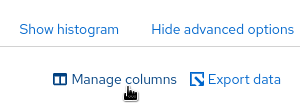
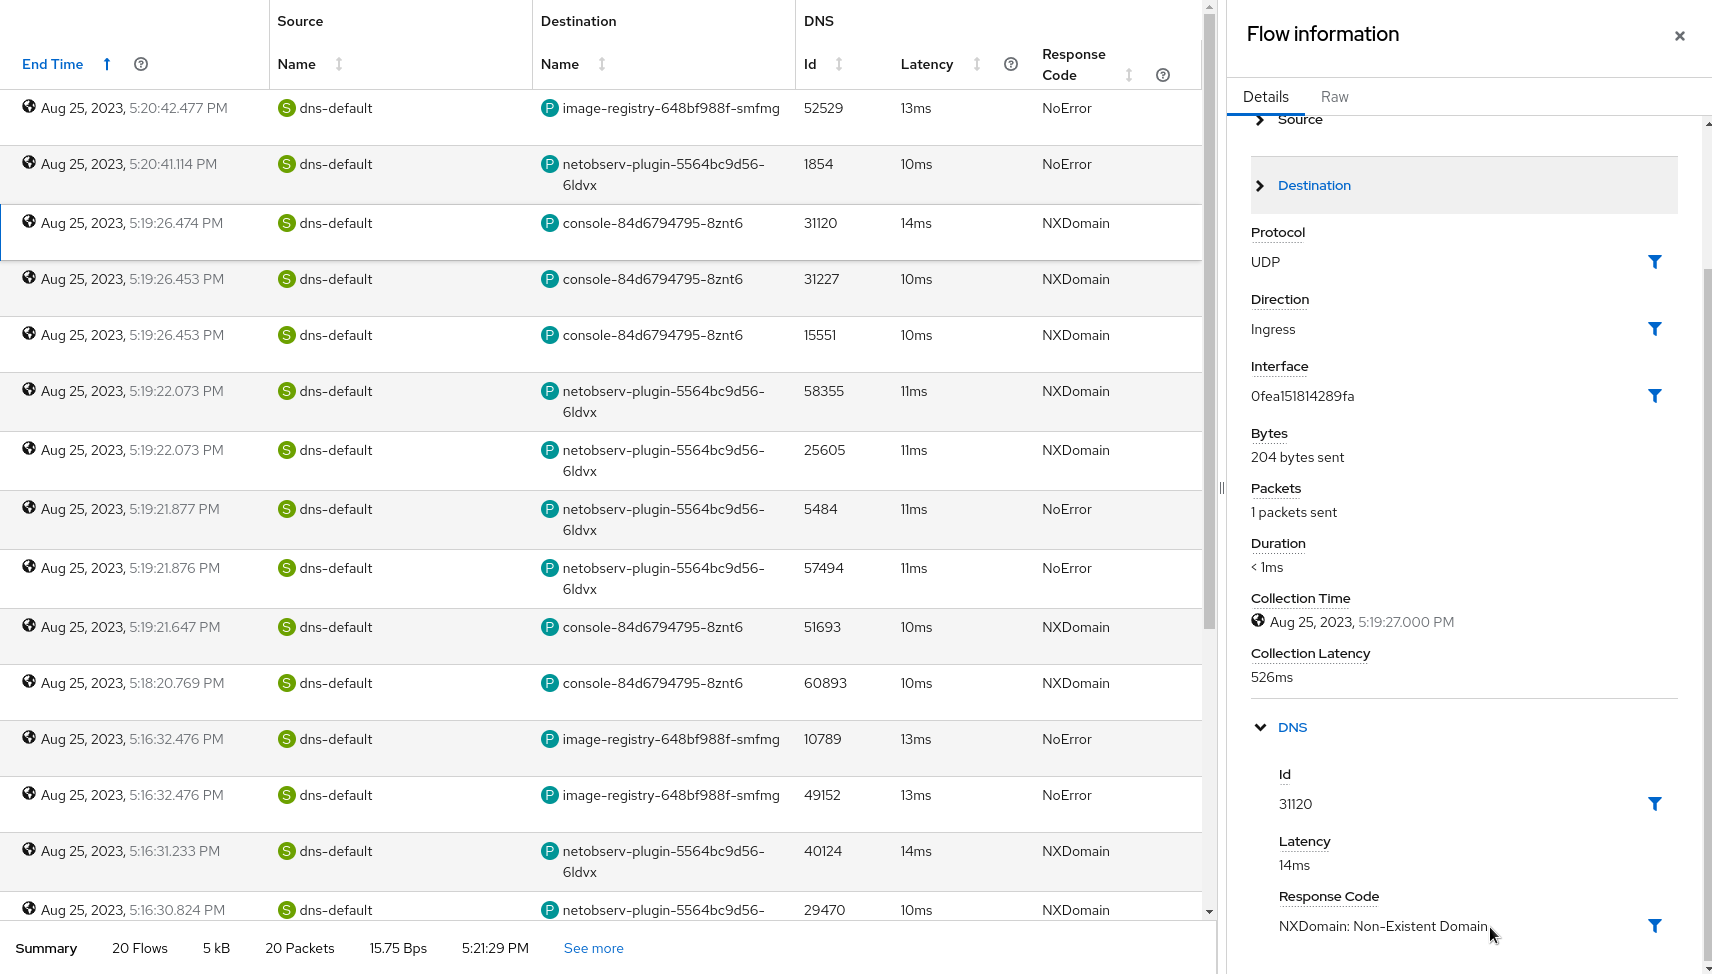
The table view adds the new DNS columns Id, Latency, and Response code, which are available from the advanced options -> manage columns popup:
The DNS flows display this information in both the table and the side panel:
Future support plans
- Adding tracking capability for mDNS.
- Adding support for DNS over TCP.
- Investigating options to handle DNS over TLS where the DNS header is fully encrypted.
Feedback
We hope you liked this article!
Netobserv is an open source project available on GitHub. Feel free to share your ideas, use cases, or ask the community for help.
執筆者紹介

チャンネル別に見る

自動化
テクノロジー、チームおよび環境に関する IT 自動化の最新情報

AI (人工知能)
お客様が AI ワークロードをどこでも自由に実行することを可能にするプラットフォームについてのアップデート

オープン・ハイブリッドクラウド
ハイブリッドクラウドで柔軟に未来を築く方法をご確認ください。

セキュリティ
環境やテクノロジー全体に及ぶリスクを軽減する方法に関する最新情報

エッジコンピューティング
エッジでの運用を単純化するプラットフォームのアップデート

インフラストラクチャ
世界有数のエンタープライズ向け Linux プラットフォームの最新情報

アプリケーション
アプリケーションの最も困難な課題に対する Red Hat ソリューションの詳細

オリジナル番組
エンタープライズ向けテクノロジーのメーカーやリーダーによるストーリー
製品
ツール
試用、購入、販売
コミュニケーション
Red Hat について
エンタープライズ・オープンソース・ソリューションのプロバイダーとして世界をリードする Red Hat は、Linux、クラウド、コンテナ、Kubernetes などのテクノロジーを提供しています。Red Hat は強化されたソリューションを提供し、コアデータセンターからネットワークエッジまで、企業が複数のプラットフォームおよび環境間で容易に運用できるようにしています。
言語を選択してください
Red Hat legal and privacy links
- Red Hat について
- 採用情報
- イベント
- 各国のオフィス
- Red Hat へのお問い合わせ
- Red Hat ブログ
- ダイバーシティ、エクイティ、およびインクルージョン
- Cool Stuff Store
- Red Hat Summit